Fig. 4
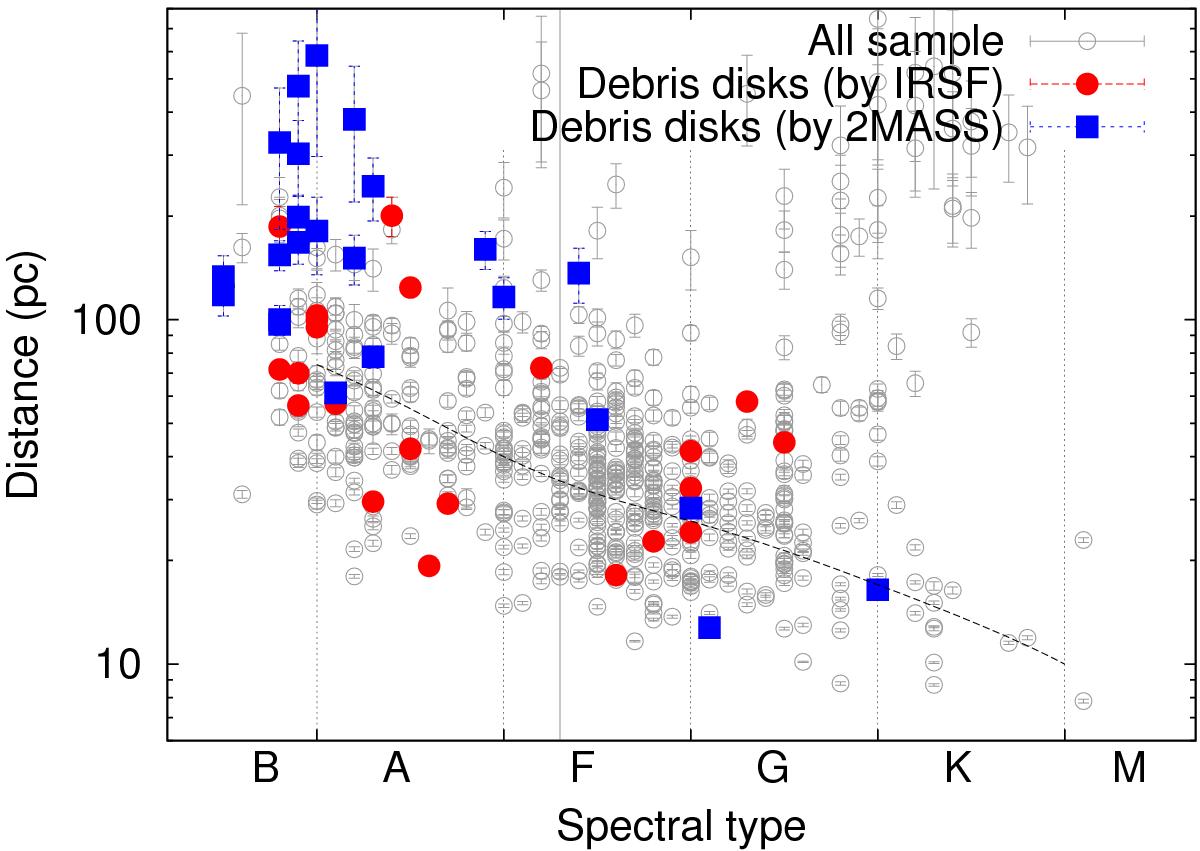
Distance plotted as a function of the spectral type for our sample. The open circles indicate all the 678 sample. The filled circles and filled boxes indicate the debris-disk candidates with the IRSF and 2MASS measurements, respectively. The dotted curve indicates the detection limit for objects without IR excess according to our definition.
Current usage metrics show cumulative count of Article Views (full-text article views including HTML views, PDF and ePub downloads, according to the available data) and Abstracts Views on Vision4Press platform.
Data correspond to usage on the plateform after 2015. The current usage metrics is available 48-96 hours after online publication and is updated daily on week days.
Initial download of the metrics may take a while.