Fig. 3
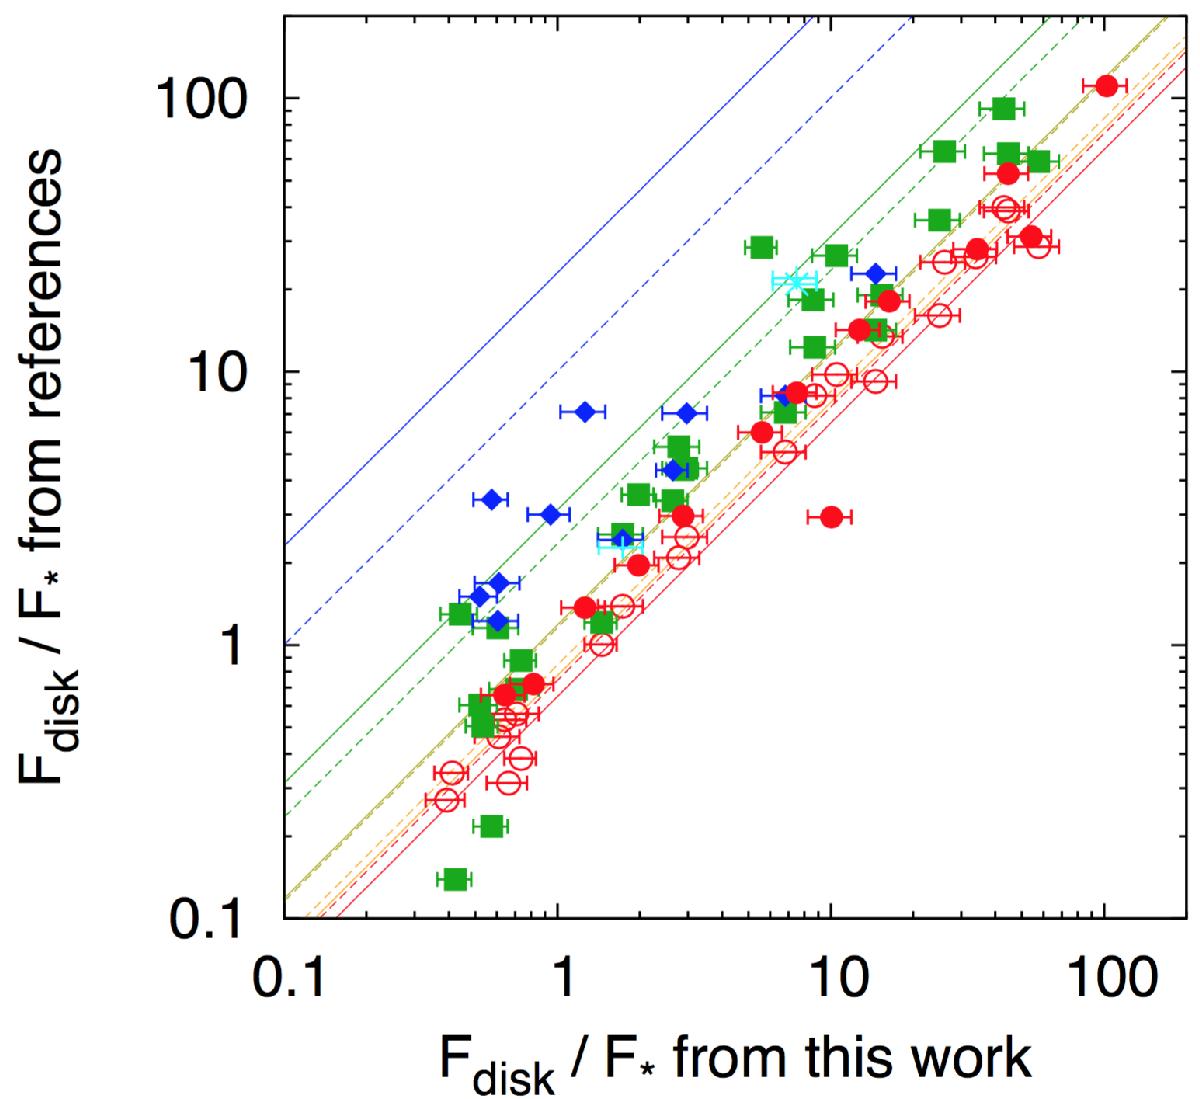
Flux ratio (Fdisk/F∗) in the previous works plotted against the flux ratio (for the AKARI 18 μm) in this work for the same stars. The filled circles, open circles, filled squares, filled diamonds, pluses, crosses, open triangles, and open squares indicate the flux ratios for the AKARI 18 μm data by Fujiwara et al. (2013), those by McDonald et al. (2012), the WISE 22 μm data by McDonald et al. (2012), the IRAS 25 μm data by McDonald et al. (2012), the Spitzer/MIPS 24 μm data by Su et al. (2006), those by Rieke et al. (2005), those by Trilling et al. (2008), and those by Bryden et al. (2006), respectively. For reference, the red, orange, yellow, green, and blue lines indicate locations in this plot when the disk emission is the blackbody with T = 800, 400, 200, 100, and 50 K, respectively. The dashed lines correspond to the Spitzer 24 μm flux, and dash-dot-dashed lines correspond to the WISE 22 μm flux.
Current usage metrics show cumulative count of Article Views (full-text article views including HTML views, PDF and ePub downloads, according to the available data) and Abstracts Views on Vision4Press platform.
Data correspond to usage on the plateform after 2015. The current usage metrics is available 48-96 hours after online publication and is updated daily on week days.
Initial download of the metrics may take a while.