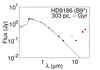
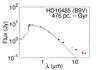
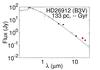
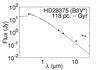
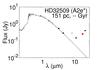
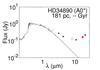
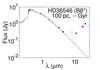
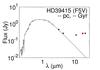
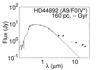
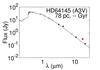
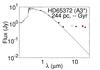
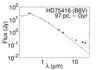
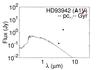
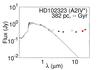
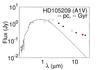
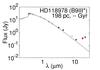
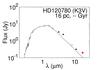
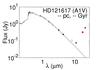
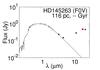
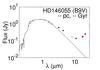
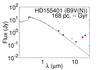
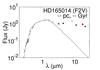
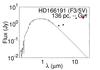
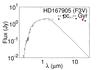
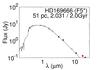
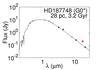
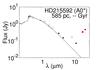
Fig. F.1
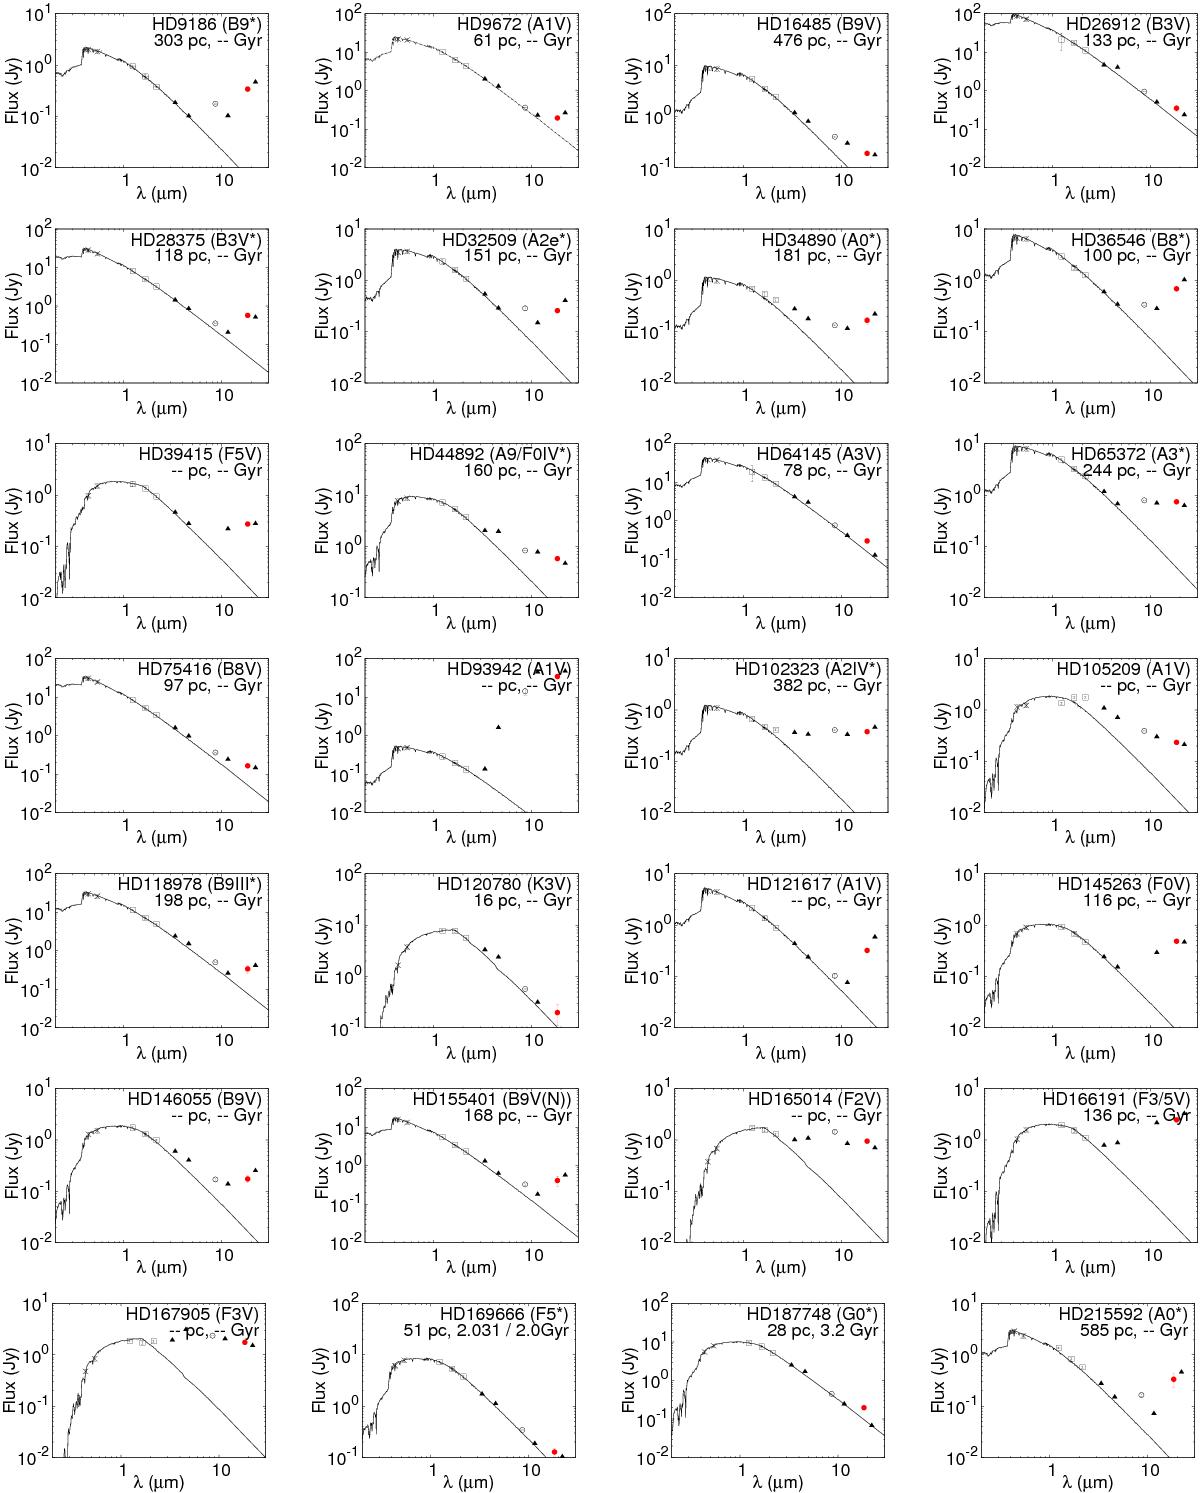
Optical to mid-IR SEDs of our debris-disk candidates with 18 μm excess emission. Crosses, open squares, filled squares, open circles, filled circles, and triangles indicate the photometric data points measured with Hipparcos (VT, BT) and USNO-B (I, z), 2MASS (J, H, Ks), IRSF (J, H, Ks), AKARI 9 μm, AKARI 18 μm, and WISE (3.4, 4.6, 12, 22 μm), respectively. The red filled circles indicate AKARI 18 μm flux used for excess identification. Solid curves indicate the contribution of the photosphere estimated on the basis of the optical to near-IR fluxes of the objects.

Current usage metrics show cumulative count of Article Views (full-text article views including HTML views, PDF and ePub downloads, according to the available data) and Abstracts Views on Vision4Press platform.
Data correspond to usage on the plateform after 2015. The current usage metrics is available 48-96 hours after online publication and is updated daily on week days.
Initial download of the metrics may take a while.