| Issue |
A&A
Volume 600, April 2017
|
|
|---|---|---|
| Article Number | L9 | |
| Number of page(s) | 4 | |
| Section | Letters | |
| DOI | https://doi.org/10.1051/0004-6361/201730700 | |
| Published online | 04 April 2017 | |
The long-period binary central stars of the planetary nebulae NGC 1514 and LoTr 5⋆,⋆⋆
1 Instituto de Astrofísica de Canarias, 38205 La Laguna, Tenerife, Spain
e-mail: This email address is being protected from spambots. You need JavaScript enabled to view it.
2 Departamento de Astrofísica, Universidad de La Laguna, 38206 La Laguna, Tenerife, Spain
3 Instituut voor Sterrenkunde, KU Leuven, Celestijnenlaan 200D bus 2401, 3001 Leuven, Belgium
e-mail: This email address is being protected from spambots. You need JavaScript enabled to view it.
4 Instituto de Física y Astronomía, Facultad de Ciencias, Universidad de Valparaíso, Av. Gran Bretaña 1111, 5030 Casilla, Valparaíso, Chile
5 Herschel Science Centre, European Space Astronomy Centre, ESA, PO Box 78, Villanueva de la Cañada, Spain
6 ISDEFE, Beatriz de Bobadilla 3, 28040 Madrid, Spain
7 Department of Physics & Astronomy, Macquarie University, Sydney, NSW 2109, Australia
8 Astronomy, Astrophysics and Astrophotonics Research Centre, Macquarie University, Sydney, NSW 2109, Australia
Received: 27 February 2017
Accepted: 15 March 2017
Abstract
The importance of long-period binaries for the formation and evolution of planetary nebulae is still rather poorly understood, which in part is due to the lack of central star systems that are known to comprise such long-period binaries. Here, we report on the latest results from the on-going Mercator-HERMES survey for variability in the central stars of planetary nebulae. We present a study of the central stars of NGC 1514, BD+30°623, the spectrum of which shows features associated with a hot nebular progenitor as well as a possible A-type companion. Cross-correlation of high-resolution HERMES spectra against synthetic spectra shows the system to be a highly eccentric (e ~ 0.5) double-lined binary with a period of ~3300 days. Previous studies indicated that the cool component might be a horizontal branch star of mass ~0.55 M⊙, but the observed radial velocity amplitudes rule out such a low mass. If we assume that the nebular symmetry axis and binary orbital plane are perpendicular, then the data are more consistent with a post-main-sequence star ascending towards the giant branch. We also present the continued monitoring of the central star of LoTr 5, HD 112313, which has now completed one full cycle, allowing the orbital period (P~2700 days) and eccentricity (e ~ 0.3) to be derived. To date, the orbital periods of BD+30°623 and HD 112313 are the longest to have been measured spectroscopically in the central stars of planetary nebulae. Furthermore, these systems, along with BD+33°2642, comprise the only spectroscopic wide-binary central stars currently known.
Key words: binaries: spectroscopic / stars: chemically peculiar / planetary nebulae: individual: LoTr 5 / planetary nebulae: individual: NGC 1514 / techniques: radial velocities
Based on observations made with the Mercator Telescope, operated on the island of La Palma by the Flemish Community, at the Spanish Observatorio del Roque de los Muchachos of the Instituto de Astrofísica de Canarias.
The radial velocity data for both objects are only available at the CDS via anonymous ftp to cdsarc.u-strasbg.fr (130.79.128.5) or via http://cdsarc.u-strasbg.fr/viz-bin/qcat?J/A+A/600/L9
© ESO, 2017
1. Introduction
It is now clear that a binary pathway is responsible for a significant fraction of planetary nebulae (PNe), with approximately 20% of nebulae hosting detectable close-binary central stars (CSs; Miszalski et al. 2009a). Space-based observations, however, have indicated that the true close-binary fraction may, in fact, be much larger (De Marco et al. 2015). While the importance of such close binaries in forming axisymmetric PNe is now beyond question, the shaping influence of wider binaries (which avoid the common envelope phase; Ivanova et al. 2013; De Marco 2009) is still uncertain. Hydrodynamic simulations have demonstrated that the mass transfer from an asymptotic giant branch (AGB) star to a companion in a wide-binary can be, under certain circumstances, greatly enhanced with respect to the simple Bondi-Hoyle-Lyttleton accretion rate, with significant material also deposited into the orbital plane of the binary (Theuns et al. 1996). Even if the right conditions do not arise and the accretion rate onto the companion is modest, simulations show that the focussing of the AGB wind by the companion should still cause a departure from spherical symmetry (e.g. Edgar et al. 2008). The results of these simulations would seem to indicate that wide binaries can also have a significant influence on the morphology of any resulting PN, but there are so few PNe known to harbour wide binaries that it is particularly difficult to characterise their influence observationally.
Several extremely wide visual binaries have been discovered using the Hubble Space Telescope (Ciardullo et al. 1999), but these systems are so wide that it is highly unlikely that there is significant interaction between the components of the central binary. A few wide systems have been discovered through the composite nature of the spectra of their CSs (e.g. Hen 2-172; Pereira et al. 2010), many of which show companion stars that have been contaminated by material transferred from the nebular progenitor while it was on the AGB (known as barium stars because of the prominent presence of barium lines in the spectrum of the contaminated companion; Bond et al. 2003; Miszalski et al. 2012, 2013). The morphologies of these systems indeed seem to indicate that such wide binaries may have an important shaping influence on their host PNe, with a prevalence for dense equatorial rings and bipolar structures (Tyndall et al. 2013) similar to those seen in the close binary population (Miszalski et al. 2009b). Based on studies of naked barium stars (i.e. those without surrounding PNe), these systems are expected to present orbital periods roughly in the range of 100−10 000 days (e.g. Van der Swaelmen et al. 2017, and references therein). However, to date, only one wide-binary CS, BD+33°2642 (PN G052.7+50.7), has a confirmed orbital period (at 1105 ± 24 days), and intriguingly, it is not a barium star (Van Winckel et al. 2014). De Marco et al. (2004) found that 10 out of a sample of 11 CSs (including BD+33°2642) that were monitored spectroscopically showed variable radial velocities, suggesting that there may be a significant population of as yet undiscovered long-period binary CSs.
Here, we present the results of the long-term radial velocity monitoring programme of PN CSs responsible for determining the orbital period of BD+33°2642. The survey employs the HERMES spectrograph (Raskin et al. 2011) mounted on the 1.2 m Mercator Telescope at the Observatorio del Roque de Los Muchachos on the Spanish island of La Palma. The programme has been running since the installation of HERMES in 2009 and takes advantage of the instrument’s high throughput, stability, and spectral resolution to search for small-amplitude radial velocity variations associated with long-period variables (Van Winckel 2015). Further details of the instrument operation and standardised data reduction for the programme can be found in Raskin et al. (2011) and Van Winckel et al. (2014).
This Letter is organised as follows: Sect. 2 introduces NGC 1514, and the results related to its CS are found in Sect. 3. In Sect. 4 we present an update of the results presented in Van Winckel et al. (2014) on LoTr 5, before concluding in Sect. 5.
2. NGC 1514
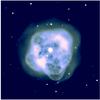 |
Fig. 1 Image of NGC 1514 produced using archival O[iii] and Hα+N[ii] images taken with the Isaac Newton Telescope Wide Field Camera. The image measures 4.5′ × 4.5′, north is up and east is left. |
The nebula NGC 1514 itself presents a highly complex structure with multiple shells (see Fig. 1; Chu et al. 1987). The outer shell appears more or less elliptical, while the inner region has a more complex structure that has been interpreted as being “composed of numerous small bubbles” (Hajian et al. 1997). WISE imagery of the nebula revealed a pair of axisymmetric rings dominated by dust emission (Ressler et al. 2010), bearing striking resemblance to the symbiotic nebula Hen 2-104 (the Southern Crab; Santander-García et al. 2008). Such structures are considered to be a natural product of binary interactions (Sahai et al. 1999; Soker & Rappaport 2000), leading Ressler et al. (2010) to conclude that NGC 1514 must have been formed by an interacting binary system.
The CS of NGC 1514, BD+30°623, was first identified as displaying a composite spectrum by Kohoutek (1967), with the analysis of Kohoutek & Hekela (1967) finding the two components to be an A-type main-sequence star and a blue subdwarf (sdO, assumed to be the nebular progenitor). The more detailed analysis of Aller et al. (2015) found the spectrum of the hot component to be consistent with an sdO classification and the cool component to be an A0-type star that is most likely in a horizontal branch (HB) evolutionary phase, although the possibility that the star is a more massive post-main-sequence (post-MS) star could not be ruled out (see also Méndez et al. 2016). Montez et al. (2015) showed the CS to be a compact source of X-rays, the potential origin of which they were unable to constrain. However, the emission could arise from coronal activity of the secondary, which would be more consistent with a post-MS evolutionary status.
Repeated efforts to monitor the CS system, both photometrically and spectroscopically, for signs of variability associated with binarity have not borne fruit − most conclusively, Méndez et al. (2016) obtained high-resolution spectra over a time-span of 500 days showing no appreciable variation in radial velocity for either component. Furthermore, in addition to being stable over the course of the observations, the two components presented radial velocities that differ from one another by approximately 13 km s-1, where the radial velocity of the hot component is consistent with the weighted mean of literature measurements for the radial velocity of the nebula (there is significant variation in values in the literature, possibly indicating that this may not be completely reliable; Schneider et al. 1983). As a result, Méndez et al. (2016) concluded that the two components are, in fact, not related and merely a near-perfect chance alignment.
3. Analysis of NGC 1514
Radial velocities of the two components of the CS of NGC 1514, BD+30°623, were derived via cross-correlation of 143 spectra (an example of which is shown in Fig. 2), obtained over a time-span of nearly 2711 days, with synthetic spectra produced individually for each component. For the cool component, the synthetic spectrum fit from Aller et al. (2015) was used, while for the hot component a synthetic spectrum with parameters identical to those of Aller et al. (2015), but with solar abundances (their spectrum includes only H and He), was produced using the TMAP package (Werner et al. 2003). Regions containing lines with strong nebular contamination (i.e. Balmer lines, O[iii] at 4959 and 5007 Å) or which could present contributions from either component (i.e. He ii 4541 Å) were masked off in order to avoid contamination in the resulting cross-correlation functions. The resulting radial velocity variations are plotted in Fig. 3, clearly demonstrating a long-term variability due to a highly eccentric binary. From the figure, it is easy to see why Méndez et al. (2016) found no evidence of orbital motion in their data given that the change in radial velocity for both components is of order 1 km s-1 during time-span of their observations (grey shaded area in Fig. 3). Over those dates, our observations indeed agree well with the confidence ranges (the dark grey shaded areas in Fig. 3) for the radial velocities of each component given by Méndez et al. (2016).
An orbital solution was derived through simultaneous fitting of the two radial velocity curves, with the resulting parameters listed in Table 1. The fits are also shown overlaid on the radial velocity data in Fig. 3, from which the quality of the fit to the hot component is evident. The cool component, however, is not so well fit. Fitting to the measured radial velocities of the cool component alone results in a greater eccentricity value (~0.8), lower systemic velocity (~48 km s-1), and larger amplitude (~7 km s-1) compared to the values determined by simultaneous fitting of the two curves. However, the overall fit to the cool component radial velocity curve does not improve greatly, and the values listed in Table 1 lie comfortably within 1σ of the values derived from fitting the cool component independently. The poor fit and general scatter of the points is almost certainly attributable to the rotational velocity of the star, which, while not extreme (~40 km s-1; Greenstein 1972), is much higher than the amplitude of the orbital motion.
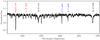 |
Fig. 2 Example subsection of a HERMES spectrum of BD+30°623 with selected features from both hot (blue) and cool (red) components marked. Marked in black are He ii absorption features that may contain contributions from both components and were therefore masked off in the analysis. |
Aller et al. (2015) found that the cool A-type component could either be on the HB with mass ~0.55 M⊙ or, alternatively, a post-MS star with mass ~3 M⊙. While the observed radial velocity amplitude ratio (and therefore mass ratio) of the SB2 binary has a large uncertainty that is mainly due to the large scatter in the velocities of the cool component, we can safely state that the mass ratio, q, is ≳2. This mass ratio effectively rules out the HB scenario, regardless of the possible mass of the hot component. However, the masses of both components can be estimated by assuming that the orbital plane lies perpendicular to the nebular symmetry axis, as predicted by PN shaping models and observed in close binary CSs Hillwig et al. (2016). Ressler et al. (2010) determine a nebular inclination of 59° (i.e. a 31° inclination for the binary), which, when combined with the radial velocity amplitudes and measured eccentricity, implies a mass of 2.3 ± 0.8 M⊙ for the cool secondary (not consistent with the HB scenario). The mass for the hot primary is found to be 0.9 ± 0.7 M⊙, greater than a typical sdO star mass, but still well within 1σ.
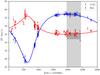 |
Fig. 3 Radial velocity curves of the hot and cool components of BD+30°623. The light grey shaded region marks the time coverage of the study of Méndez et al. (2016), while the dark grey regions enclose their confidence limits for the radial velocities of the two components. |
4. Update on LoTr 5
Van Winckel et al. (2014) presented the first detections of orbital motion that is due to a long-period binary CS, with the detections of variability in BD+33°2642 and LoTr 5. At that time, the data for LoTr 5 showed only a slow decline of ~10 km s-1 over a time-span of 1807 days. Monitoring of the CS of LoTr 5 (HD 112313) has continued as part of the Mercator-HERMES programme and has now covered an entire orbital period. The now-complete radial velocity curve, obtained using the same method as that of Van Winckel et al. (2014), is shown in Fig. 4 along with a fit to the orbital solution (the parameters of which are listed in Table 2). We do not find any evidence of the second component reported by Jasniewicz et al. (1987), neither directly in our spectra nor at the reported velocity amplitudes (K = 40 km s-1) in our cross-correlation functions.
The primary mass function, f(m1), of HD 112313 is found to be 0.025 ± 0.003 M⊙, which is lower than that estimated by Van Winckel et al. (2014, as their estimation assumed a circular orbit). However, the apparent inconsistency with the nebular inclination as derived by Graham et al. (2004) still persists because at that inclination (i = 17°) and for any reasonable value of the mass of the G-type secondary component (i.e. 1 M⊙), the mass of the primary component would still be in excess of 2 M⊙. As the central white dwarf cannot have such a high mass (greater than the Chandrasekhar mass), only a few conclusions are possible.
-
The inclination derived by Grahamet al. (2004) is incorrect. As thedetermination of primary mass is highly dependent on theinclination (to the third power), a small error in the inclinationcould resolve the issue (for example, at inclinations >23° the mass of the primary would be <1.4 M⊙).
-
The nebular waist is not coplanar with the binary plane, at odds with the results from PNe with close-binary CSs, which are found to always be coplanar (Hillwig et al. 2016).
-
The system is a hierarchical triple where the central white dwarf forms part of a close binary, the total mass of which is ≳2 M⊙. The spectral non-detection of a solar-mass close-binary companion as well as stability considerations throughout the system’s evolution question the likelihood of this conclusion.
5. Conclusions
We present derivations of the orbital periods of the CSs of NGC 1514 and LoTr 5 (the latter of which was shown to be variable in a previous paper; Van Winckel et al. 2014), which are now the CSs with the longest known orbital periods.
The CS of NGC 1514, BD+30°623, has long been known to present a composite spectrum with features attributable to a hot sdO star (assumed to be the nebular progenitor) and a cooler A0-type star. Previously radial velocity studies, including the long-term (~1 yr) monitoring of Méndez et al. (2016), failed to find clear signs of variability, with some authors even going so far as to claim that the two stars are unrelated (Méndez et al. 2016). Given the ~9 yr orbital period and high (e ~ 0.5) eccentricity, it is no surprise that previous studies have failed to see signs of orbital motion, let alone derive the orbital period; this highlights the importance of extremely long-term (~years) monitoring programmes (Van Winckel 2015). Previous studies of the system presented two different scenarios for the A0 component of the composite spectrum: a low-mass HB star, or a more massive post-MS star (Aller et al. 2015). The amplitudes of the radial velocity curves rule out the HB scenario, while adopting the nebular inclination provides rough mass estimates for both components of MHot ~ 0.9 M⊙ and MCool ~ 2.3 M⊙.
The CS of LoTr 5, HD 112313, was demonstrated in a previous paper to show radial velocity variability associated with binarity (Van Winckel et al. 2014), but a full orbit had not yet been covered. With the addition of new data, the full orbit has now been sampled, allowing the derivation of the orbital parameters and showing HD 112313 to have an eccentricity of ~0.3 and an orbital period of ~8 yr. If the inclination is indeed 17° (i.e. perpendicular to the nebular symmetry axis; Graham et al. 2004), then the mass function of the primary implies an impossibly high white dwarf mass (>1.4 M⊙). This may be an indication that the binary system is not coplanar with the waist of the nebula, or, perhaps more likely, that the previous determination of the nebular inclination is incorrect. Alternatively, the system may be a hierarchical triple where the observed G-type star is in wide orbit around a binary system comprising the nebular progenitor and a close companion of mass ~1.5 M⊙. We encourage further study of both the nebula and its CS to evaluate these scenarios.
Acknowledgments
Based on observations obtained with the HERMES spectrograph, which is supported by the Fund for Scientific Research of Flanders (FWO), Belgium, the Research Council of KU Leuven, Belgium, the Fonds National de la Recherche Scientifique (FNRS), Belgium, the Royal Observatory of Belgium, the Observatoire de Genève, Switzerland and the Thüringer Landessternwarte Tautenburg, Germany. The Mercator telescope is operated thanks to grant number G.0C31.13 of the FWO under the “Big Science” initiative of the Flemish government. H.V.W. acknowledges support from The Research Council of the KU Leuven under grant number GOA/2013/012. A.A. acknowledges support from FONDECYT through postdoctoral grant 3160364. The authors wish to thank all observers of the HERMES consortium institutes (KU Leuven, ULB, Royal Observatory, Belgium, and Sternwarte Tautenburg, Germany) who contributed to this monitoring programme. This paper makes use of data obtained from the Isaac Newton Group Archive (maintained as part of the CASU Astronomical Data Centre at the Institute of Astronomy, Cambridge). The TMAW tool (http://astro.uni-tuebingen.de/~TMAW) was constructed as part of the activities of the German Astrophysical Virtual Observatory.
References
- Aller, A., Montesinos, B., Miranda, L. F., Solano, E., & Ulla, A. 2015, MNRAS, 448, 2822 [NASA ADS] [CrossRef] [Google Scholar]
- Bond, H. E., Pollacco, D. L., & Webbink, R. F. 2003, AJ, 125, 260 [NASA ADS] [CrossRef] [Google Scholar]
- Chu, Y. H., Jacoby, G. H., & Arendt, R. 1987, ApJS, 64, 529 [NASA ADS] [CrossRef] [Google Scholar]
- Ciardullo, R., Bond, H. E., Sipior, M. S., et al. 1999, AJ, 118, 488 [NASA ADS] [CrossRef] [Google Scholar]
- De Marco, O. 2009, PASP, 121, 316 [NASA ADS] [CrossRef] [Google Scholar]
- De Marco, O., Bond, H. E., Harmer, D., & Fleming, A. J. 2004, ApJ, 602, L93 [NASA ADS] [CrossRef] [Google Scholar]
- De Marco, O., Long, J., Jacoby, G. H., et al. 2015, MNRAS, 448, 3587 [NASA ADS] [CrossRef] [Google Scholar]
- Edgar, R. G., Nordhaus, J., Blackman, E. G., & Frank, A. 2008, ApJ, 675, L101 [NASA ADS] [CrossRef] [Google Scholar]
- Graham, M. F., Meaburn, J., López, J. A., Harman, D. J., & Holloway, A. J. 2004, MNRAS, 347, 1370 [NASA ADS] [CrossRef] [Google Scholar]
- Greenstein, J. L. 1972, ApJ, 173, 367 [NASA ADS] [CrossRef] [Google Scholar]
- Hajian, A. R., Frank, A., Balick, B., & Terzian, Y. 1997, ApJ, 477, 226 [NASA ADS] [CrossRef] [Google Scholar]
- Hillwig, T. C., Jones, D., Marco, O. D., et al. 2016, ApJ, 832, 125 [NASA ADS] [CrossRef] [Google Scholar]
- Ivanova, N., Justham, S., Chen, X., et al. 2013, A&ARv, 21, 59 [Google Scholar]
- Jasniewicz, G., Duquennoy, A., & Acker, A. 1987, A&A, 180, 145 [NASA ADS] [Google Scholar]
- Kohoutek, L. 1967, Bull. Astron. Inst. Czechoslovakia, 18, 103 [NASA ADS] [Google Scholar]
- Kohoutek, L., & Hekela, J. 1967, Bull. Astron. Inst. Czechoslovakia, 18, 203 [NASA ADS] [Google Scholar]
- Méndez, R. H., Kudritzki, R.-P., & Urbaneja, M. A. 2016, ApJ, 829, 73 [NASA ADS] [CrossRef] [Google Scholar]
- Miszalski, B., Acker, A., Moffat, A. F. J., Parker, Q. A., & Udalski, A. 2009a, A&A, 496, 813 [NASA ADS] [CrossRef] [EDP Sciences] [Google Scholar]
- Miszalski, B., Acker, A., Parker, Q. A., & Moffat, A. F. J. 2009b, A&A, 505, 249 [NASA ADS] [CrossRef] [EDP Sciences] [Google Scholar]
- Miszalski, B., Boffin, H. M. J., Frew, D. J., et al. 2012, MNRAS, 419, 39 [NASA ADS] [CrossRef] [Google Scholar]
- Miszalski, B., Boffin, H. M. J., Jones, D., et al. 2013, MNRAS, 436, 3068 [NASA ADS] [CrossRef] [Google Scholar]
- Montez, Jr., R., Kastner, J. H., Balick, B., et al. 2015, ApJ, 800, 8 [NASA ADS] [CrossRef] [Google Scholar]
- Pereira, C. B., Baella, N. O., Daflon, S., & Miranda, L. F. 2010, A&A, 509, A13 [NASA ADS] [CrossRef] [EDP Sciences] [Google Scholar]
- Raskin, G., van Winckel, H., Hensberge, H., et al. 2011, A&A, 526, A69 [NASA ADS] [CrossRef] [EDP Sciences] [Google Scholar]
- Ressler, M. E., Cohen, M., Wachter, S., et al. 2010, AJ, 140, 1882 [NASA ADS] [CrossRef] [Google Scholar]
- Sahai, R., Dayal, A., Watson, A. M., et al. 1999, AJ, 118, 468 [NASA ADS] [CrossRef] [Google Scholar]
- Santander-García, M., Corradi, R. L. M., Mampaso, A., et al. 2008, A&A, 485, 117 [NASA ADS] [CrossRef] [EDP Sciences] [Google Scholar]
- Schneider, S. E., Terzian, Y., Purgathofer, A., & Perinotto, M. 1983, ApJS, 52, 399 [NASA ADS] [CrossRef] [Google Scholar]
- Soker, N., & Rappaport, S. 2000, ApJ, 538, 241 [NASA ADS] [CrossRef] [Google Scholar]
- Theuns, T., Boffin, H. M. J., & Jorissen, A. 1996, MNRAS, 280, 1264 [NASA ADS] [CrossRef] [Google Scholar]
- Tyndall, A. A., Jones, D., Boffin, H. M. J., et al. 2013, MNRAS, 436, 2082 [NASA ADS] [CrossRef] [Google Scholar]
- Van der Swaelmen, M., Boffin, H. M. J., Jorissen, A., & Van Eck, S. 2017, A&A, 597, A68 [NASA ADS] [CrossRef] [EDP Sciences] [Google Scholar]
- Van Winckel, H. 2015, in EAS Pub. Ser., 71, 121 [Google Scholar]
- Van Winckel, H., Jorissen, A., Exter, K., et al. 2014, A&A, 563, L10 [NASA ADS] [CrossRef] [EDP Sciences] [Google Scholar]
- Werner, K., Deetjen, J. L., Dreizler, S., et al. 2003, in Stellar Atmosphere Modeling, eds. I. Hubeny, D. Mihalas, & K. Werner, ASP Conf. Ser., 288, 31 [Google Scholar]
All Tables
All Figures
|
Fig. 1 Image of NGC 1514 produced using archival O[iii] and Hα+N[ii] images taken with the Isaac Newton Telescope Wide Field Camera. The image measures 4.5′ × 4.5′, north is up and east is left. |
| In the text | |
|
Fig. 2 Example subsection of a HERMES spectrum of BD+30°623 with selected features from both hot (blue) and cool (red) components marked. Marked in black are He ii absorption features that may contain contributions from both components and were therefore masked off in the analysis. |
| In the text | |
|
Fig. 3 Radial velocity curves of the hot and cool components of BD+30°623. The light grey shaded region marks the time coverage of the study of Méndez et al. (2016), while the dark grey regions enclose their confidence limits for the radial velocities of the two components. |
| In the text | |
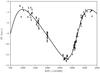 |
Fig. 4 Radial velocity curve of HD 112313 (PN LoTr 5). |
| In the text | |
Current usage metrics show cumulative count of Article Views (full-text article views including HTML views, PDF and ePub downloads, according to the available data) and Abstracts Views on Vision4Press platform.
Data correspond to usage on the plateform after 2015. The current usage metrics is available 48-96 hours after online publication and is updated daily on week days.
Initial download of the metrics may take a while.