Free Access
Fig. 7
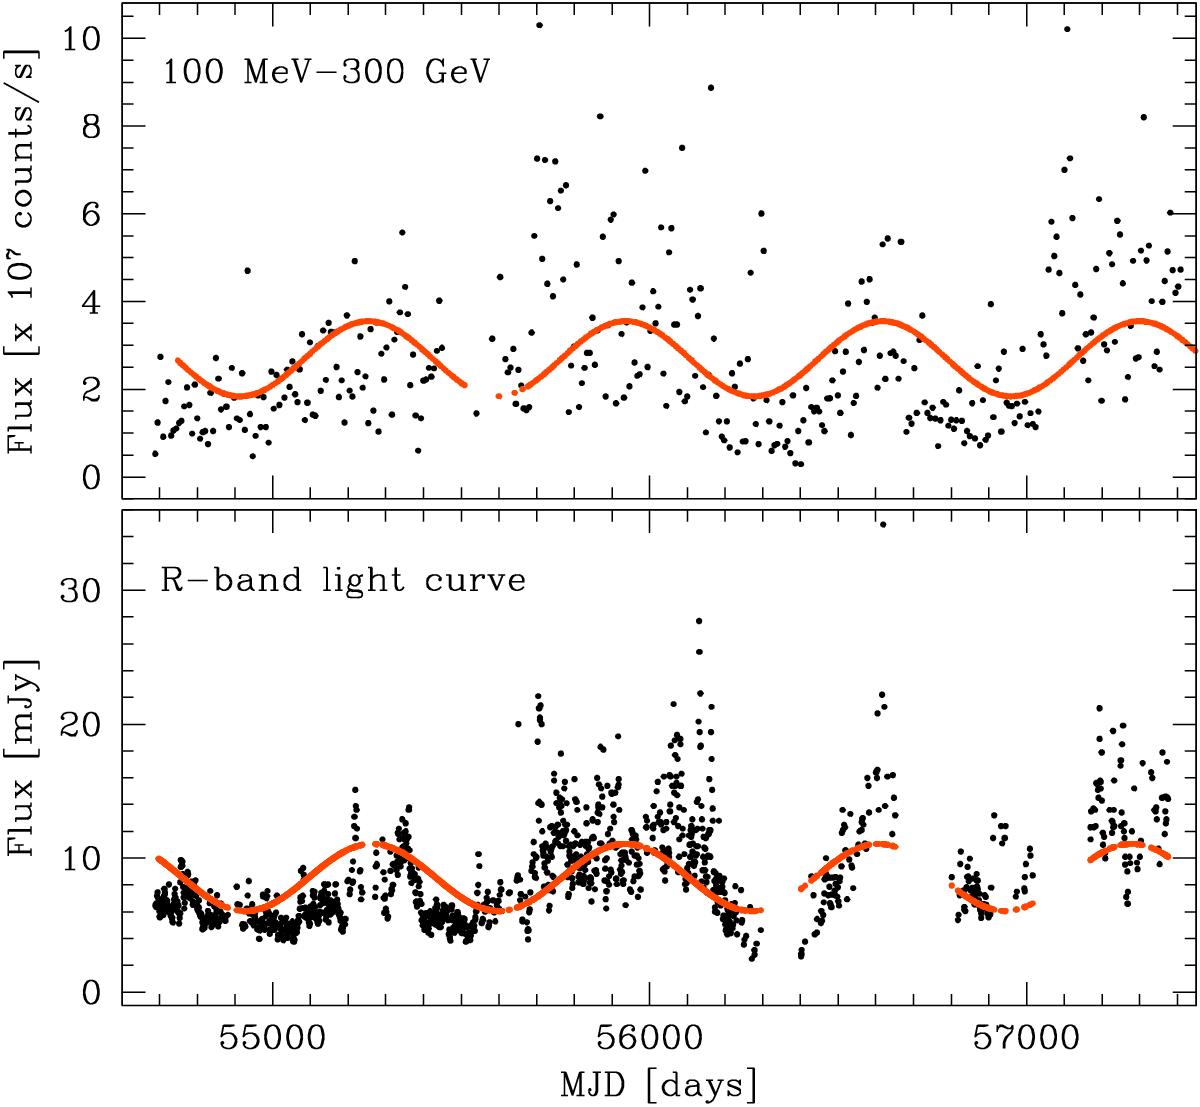
Comparison between BL Lac light curves in 100 MeV–300 GeV energy range and in R-band during the Fermi observational span. As within the errors γ-ray and optical periodogram peaks are the same, a sinusoidal model with the intermediate value of T = 676 days is superimposed. Error bars are omitted for readability.
This figure is made of several images, please see below:
Current usage metrics show cumulative count of Article Views (full-text article views including HTML views, PDF and ePub downloads, according to the available data) and Abstracts Views on Vision4Press platform.
Data correspond to usage on the plateform after 2015. The current usage metrics is available 48-96 hours after online publication and is updated daily on week days.
Initial download of the metrics may take a while.