Fig. 6
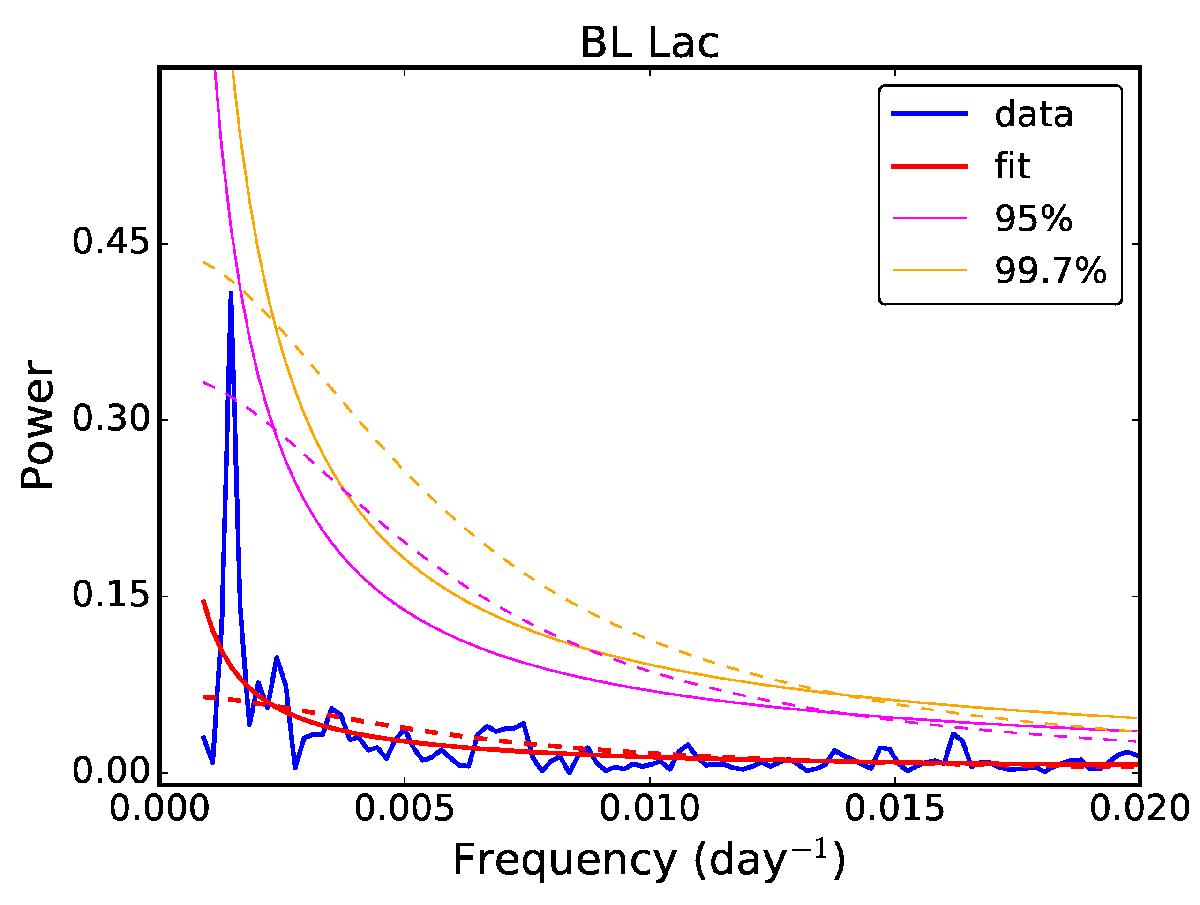
Global significances for the peaks in the periodogram obtained linearly adding the γ-ray and optical PDSs of BL Lac. The Lomb-Scargle spectrum is given in blue. Solid and dashed lines indicate PL and AR1 models, respectively. Red, purple and yellow lines are the best-fit noise spectrum, 95.0% and 99.7% false alarm levels, respectively.
Current usage metrics show cumulative count of Article Views (full-text article views including HTML views, PDF and ePub downloads, according to the available data) and Abstracts Views on Vision4Press platform.
Data correspond to usage on the plateform after 2015. The current usage metrics is available 48-96 hours after online publication and is updated daily on week days.
Initial download of the metrics may take a while.