Fig. 8
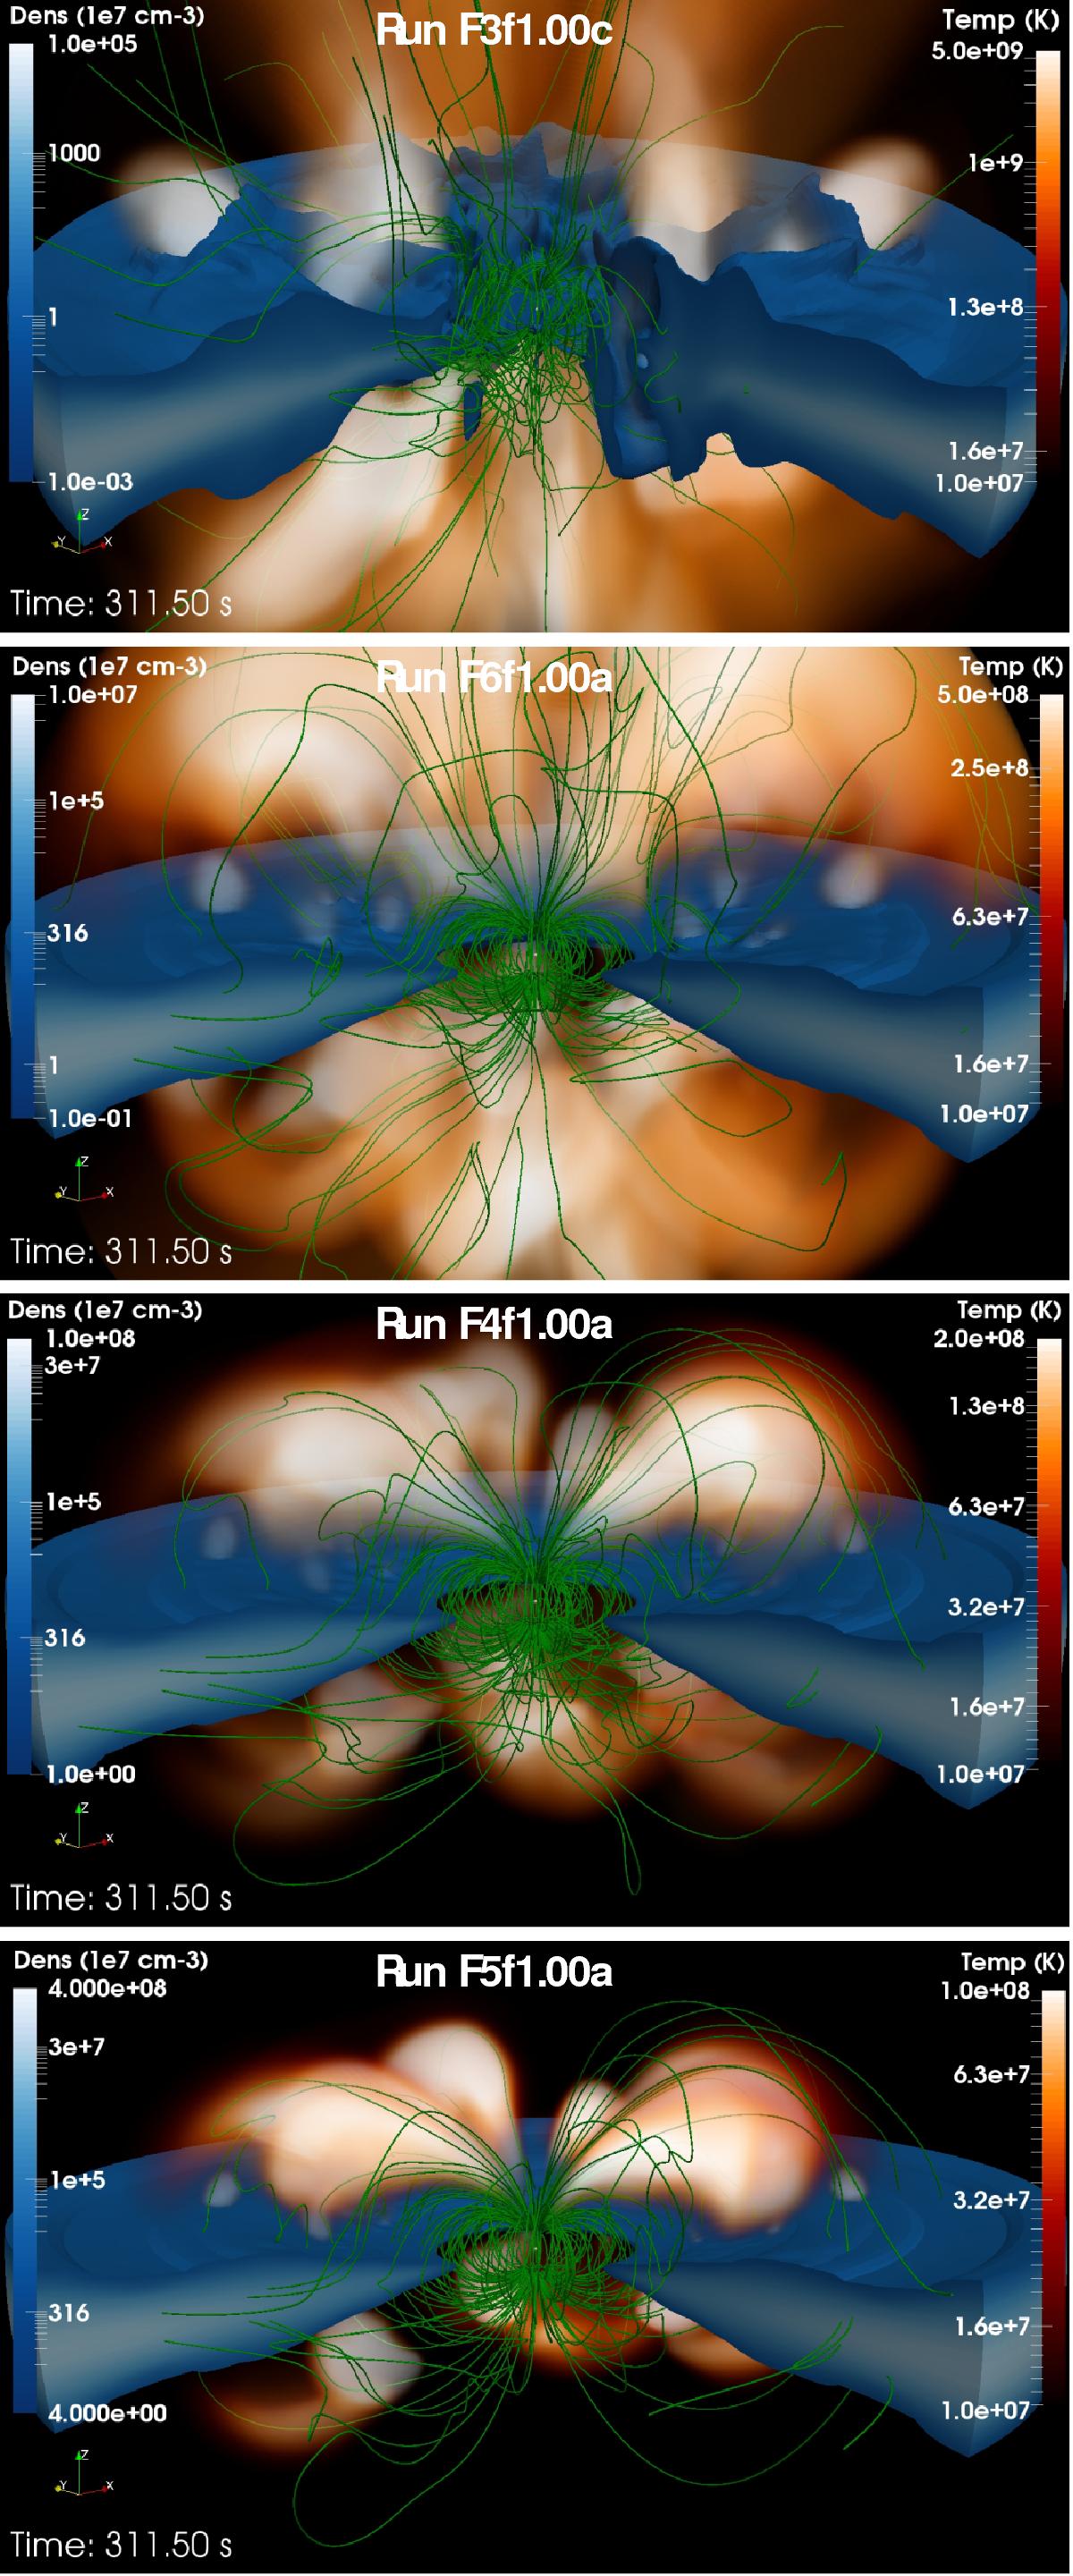
Different effects of the same energy release at the same time (t = 311.50s) on different configurations of the system with progressively denser disks and stronger magnetic field, from top to bottom. The cutaway views of the star-disk system show the mass density (blue) and the magnetic field lines (green). The 3D volume rendering of the plasma temperature is over-plotted, showing the flaring loops (red-yellow).
Current usage metrics show cumulative count of Article Views (full-text article views including HTML views, PDF and ePub downloads, according to the available data) and Abstracts Views on Vision4Press platform.
Data correspond to usage on the plateform after 2015. The current usage metrics is available 48-96 hours after online publication and is updated daily on week days.
Initial download of the metrics may take a while.