Fig. 5
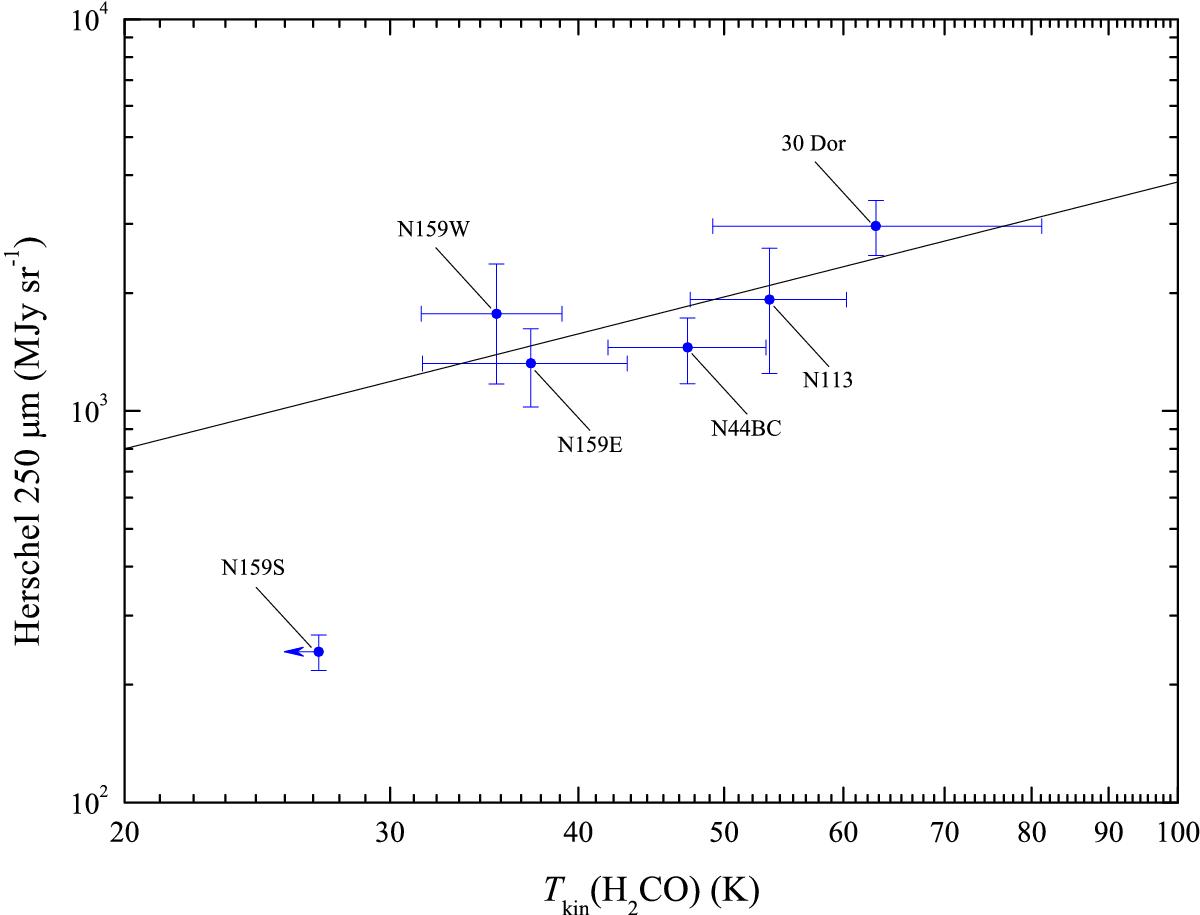
Comparison of gas kinetic temperatures derived from para-H2CO 321–220/303–202 against the Herschel 250 μm flux. The straight line is the result from a linear fit for the five sources with all 218 GHz para-H2CO lines detected. N159S provides with respect to Tkin a 3σ upper limit. Thus this point may be located much farther to the left, closer to the linear fit obtained from the other five sources.
Current usage metrics show cumulative count of Article Views (full-text article views including HTML views, PDF and ePub downloads, according to the available data) and Abstracts Views on Vision4Press platform.
Data correspond to usage on the plateform after 2015. The current usage metrics is available 48-96 hours after online publication and is updated daily on week days.
Initial download of the metrics may take a while.