| Issue |
A&A
Volume 600, April 2017
|
|
|---|---|---|
| Article Number | A52 | |
| Number of page(s) | 6 | |
| Section | Astrophysical processes | |
| DOI | https://doi.org/10.1051/0004-6361/201630137 | |
| Published online | 29 March 2017 | |
BeppoSAX observations of XTE J1946+274
1 Institut für Astronomie und Astrophysik, Kepler Center for Astro and Particle Physics, Sand 1, 72076 Tübingen, Germany
e-mail: This email address is being protected from spambots. You need JavaScript enabled to view it.
2 INAF–IASF di Palermo, via Ugo La Malfa 153, 90146 Palermo, Italy
Received: 25 November 2016
Accepted: 7 February 2017
Abstract
We report on the BeppoSAX monitoring of a giant outburst of the transient X-ray pulsar XTE J1946+274 in 1998. The source was detected with a flux of ~4 × 10⁻⁹ erg cm-2 s-1 (in 0.1−120 keV range). The broadband spectrum, typical for accreting pulsars, is well described by a cutoff power law with a cyclotron resonance scattering feature (CRSF) at ~38 keV. This value is consistent with earlier reports based on the observations with Suzaku at factor of ten lower luminosity, which implies that the feature is formed close to the neutron star surface rather than in the accretion column. Pulsations with P ~ 15.82 s were observed up to ~70 keV. The pulse profile strongly depends on energy and is characterised by a “soft” and a “hard” peaks shifted by half period, which suggests a strong phase dependence of the spectrum, and that two components with roughly orthogonal beam patterns are responsible for the observed pulse shape. This conclusion is supported by the fact that the CRSF, despite its relatively high energy, is only detected in the spectrum of the soft peak of the pulse profile. Along with the absence of correlation of the line energy with luminosity, this could be explained in the framework of the recently proposed “reflection” model for CRSF formation. However more detailed modelling of both line and continuum formation are required to confirm this interpretation.
Key words: X-rays: binaries
© ESO, 2017
1. Introduction
The transient X-ray pulsar XTE J1946+274 was discovered, at a flux level F(2−12) keV of ~90 mCrab, on September 15, 1998 by the All Sky Monitor (ASM) on board the Rossi X-ray Timing Explorer (RXTE; Smith & Takeshima 1998a). From archival data, it was found that the source had been brightening from ~13 mCrab on September 5 to ~ 60 mCrab on September 15. Coherent pulsations at ~15.83 s were discovered in follow-up pointed observations by RXTE (Smith & Takeshima 1998a). The source was also observed by BATSE onboard CGRO (Wilson et al. 1998) which reported a (20–50 keV) flux of ~15 mCrab.
The pulsar remained active for about three years after that as monitored by the RXTE/ASM. Following the RXTE outburst detection, the BeppoSAX Target of Opportunity Observation Program on Hard X–ray Transients was activated at F(1−10) keV ~ 44 mCrab (Campana et al. 1998), at the decline of the first, giant, outburst. The source was also observed by the Indian X-ray Astronomy Experiment (IXAE; Paul et al. 2001) that revealed double peaked pulse profiles with a pulse fraction of ~30% in the 2–6 keV and 6–18 keV energy band, and confirmed the secular spin-up of the pulsar. The observed outbursts are most likely associated with the orbital motion. Campana et al. (1999) based on RXTE/ASM data reported evidence for the ~80 d periodicity, while Wilson et al. (2003) confirmed a 169.2 d orbital period based on the X-ray timing measurements.
Verrecchia et al. (2002) identified the most likely optical counterpart as a R ~ 14 mag Be star, that shows a strong Hα emission line. This allowed them to estimate a distance of 8–10 kpc to the source based on the observed extinction. Wilson et al. (2003), using evidence for an accretion disc, estimated the distance to be d = 9.5 ± 2.9 kpc.
Several weaker outbursts followed the first one from 1998 to 2001 (Campana et al. 1999; Paul et al. 2001; Wilson et al. 2003). Similar behaviour has been also observed in other Be systems (see for example Caballero et al. 2013). The first outburst is, therefore, considered to be a giant one.
XTE J1946+274 remained in quiescence until June 2010, when the Burst Alert Telescope (BAT) on board Swift and the Gamma-ray Burst Monitor (GBM) on board Fermi observed a new outburst (Krimm et al. 2010; Finger 2010). The source has been observed with INTEGRAL (Caballero et al. 2010), Swift and RXTE (Müller et al. 2012), and Suzaku (Maitra & Paul 2013; Marcu-Cheatham et al. 2015). Also on this occasion, the source exhibited several outbursts of decreasing intensity, following the first one (Müller et al. 2012).
Based on the RXTE data from the outburst in 1998, the broadband X-ray spectrum of the source was found to be similar to that of other accreting pulsars, and a cyclotron line near 35 keV, has been reported by Heindl et al. (2001). However, based on data from the 2010 outburst, the presence of a cyclotron line at 35 keV was excluded by Müller et al. (2012), who suggested possible evidence for a cyclotron feature at ~25 keV. On the contrary, based on Suzaku data, Maitra & Paul (2013) and Marcu-Cheatham et al. (2015) found marginal evidence for a line near 35–38 keV, and no indication of the 25 keV absorption feature. In this paper we present results from the unpublished analysis of the 1998 observations of the source made with BeppoSAX, focusing on the timing and spectral properties of the source.
2. Observations
The X-ray satellite BeppoSAX (Boella et al. 1997a) was a programme of the Italian Space Agency with the participation of the Netherlands Agency for Aerospace Programs, which operated in the broad 0.1–300 keV energy band. Besides two wide field cameras (WFCs, Jager et al. 1997), the scientific payload included four narrow field instruments (NFIs): the Medium Energy Concentrator Spectrometers (MECS) operating in the energy range 1–10 keV (Boella et al. 1997b); the Low Energy Concentrator Spectrometer (LECS, 0.1–10 keV, Parmar et al. 1997); the High Pressure Gas Scintillation Proportional Counter (HPGSPC, 4–120 keV, Manzo et al. 1997); and the Phoswich Detector System (PDS, 15–300 keV, Frontera et al. 1997). In this work we have used the LECS (0.1–4 keV), the MECS (2–10 keV), the HPGHPC (4.5–34 keV) and the PDS (15–120 keV). We used the standard BeppoSAX data processing procedure described in details in BeppoSAX handbook1.
XTE J1946+274 was observed by BeppoSAX in the framework of the AO2 programme aimed at monitoring the spectral and timing behaviour of hard pulsating transients as a function of luminosity. During the decline of the 1998 giant outburst (Fig. 1) of the source, six pointed observations, at different luminosities, were performed using the NFIs (Table 1). The analysis of this data has not been published to date.
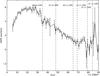 |
Fig. 1 Light curve of XTE J1946+274 as observed by RXTE/ASM. Dashed lines are BeppoSAX observations. |
Observations of the X-ray pulsar XTE J1946+274 by BeppoSAX.
3. Timing analysis
We performed a detailed timing and spectral analysis of all BeppoSAX data. For the timing analysis, the photon arrival times were corrected for motion in the solar system, and in the binary system assuming ephemeris derived by Wilson et al. (2003). To search for pulsation we used epoch folding, and the obtained period value and uncertainties were refined using the phase-connection technique. We were not able to find a common timing solution for all observations assuming a smooth variation of the period, and within individual observations the pulse arrival times are consistent with constant periods as listed in Table 2 (all uncertainties are given at 90% confidence level unless stated otherwise). The comparison of the periods measurements during the outburst reveals a generic spin-up trend as shown in Fig. 2, which can be approximated as P = 15.81951(2) s, Ṗ = −2.99(2) × 10-9 s/s, 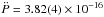 s/s2.
s/s2.
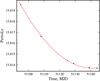 |
Fig. 2 XTE J1946+274 pulse period as observed by BeppoSAX. Uncertainties errors are given with 1σ confidence level (for the most points errors are inside the circles). |
Pulse-period history of XTE J1946+274.
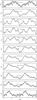 |
Fig. 3 Pulse profiles of XTE J1946+274 in 11 energy bands observed with the BeppoSAX satellite by LECS, MECS, HPGSPC and PDS instruments in 9th of October, 1998. |
The pulse profiles folded with the best-fit period for the brightest BeppoSAX observation are presented in Fig. 3. The pulse profile significantly changes with the energy and it is characterised by two main phase regions: a “soft” peak at phases ~(0.5−1) and a “hard” peak at ~(0−0.5). The soft peak dominates at low energies, while the hard peak appears at ~1 keV and steadily increases with respect to the soft peak till at energies ≥30 keV it is the only emission left. Pulsations extend up to ~70 keV. The phase difference between the soft and hard peaks is about half a phase.
The pulse profile shape also changes with luminosity as can be seen from Fig. 4. In particular, both peaks become more pronounced at lower luminosities, while the shift between the soft and hard peaks remains relatively constant.
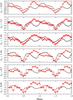 |
Fig. 4 Luminosity dependence of the soft (MECS data in 2–10 keV range, black points), and hard (PDS data in 20–40 keV, red crosses) normalised pulse profiles along the outburst. |
The fraction of pulsed flux (Fig. 5), defined as ratio (Fmax−Fmin)/(Fmax + Fmin), where Fmax and Fmin are the maximum and minimum source flux, decreases until ~4 keV, and then increases in 4–60 keV with a possible feature at ~38 keV (see, Sect. 4).
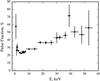 |
Fig. 5 XTE J1946+274 pulse fraction for the brightest BeppoSAX observation in 10-09-1998. The emission feature is around cyclotron line energy, Ecyc ~ 38 keV. |
4. Spectral analysis
Spectra from the LECS and MECS were extracted from circles with radii 8 and 4 arcmin respectively centred on the source, while the background was estimated from blank sky observations. The HPGSPC and PDS were operated in rocking mode, so the spectra and background were extracted from on- and off-source collimator positions using the standard BeppoSAX pipeline. For fitting the spectra we used the XSPEC package (Arnaud et al. 1999).
The broadband X-ray continuum of the pulse-phase averaged spectrum can be described with an absorbed power law cutoff at high energies. In addition, an iron line at ~6.4–6.6 keV, and an absorption line at ~38 keV for the Cyclotron Resonant Scattering Feature (CRSF) are required (Fig. 6) by the data.
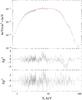 |
Fig. 6 Unfolded spectrum XTE J1946+274 on 1998-10-09 fitted with HIGHECUT+BB continuum model (top panel). The middle and bottom panels show best-fit residuals without and with inclusion of iron and cyclotron lines respectively. |
Variation parameters of XTE J1946+274 with flux, during decay of the 1998 yr outburst observed by BeppoSAX with HIGHECUT+BB continuum model.
Following the literature, we considered several models for the continuum. A power law with a high-energy cutoff and a smoothing Gaussian at cutoff energy (White et al. 1983; Coburn et al. 2002); a power law with a Fermi-Dirac cutoff (Tanaka 1986); the negative and positive power law exponential model (Mihara 1995; Makishima et al. 1999) and the Comptonisation model by (Titarchuk 1994; HIGHECUT, FDCUT, NPEX and CompTT respectively in XSPEC). For all considered continuum models the addition of an iron line at ~6.4–6.6 keV and of an absorption line with Gaussian optical depth profile (Hemphill et al. 2013) at ~38 keV was necessary.
To account for the residuals around 10 keV, similar to those reported by Müller et al. (2012), either a partial covering absorber (PC) or another absorption line at ~10 keV (with the width of ~2 keV) was required. The quality of the fit was comparable for all models tested. We have also found that the PC might be substituted with additional blackbody-like component (BB) with temperature of ~2 keV.
The parameters of the CRSF were best constrained when the continuum was fitted with the HIGHECUT model. We use this model below (see Fig. 6, Table 3) for all observations.
The best-fit parameters for the three different models: with the PC and HIGHECUT (i.e. the same as used by Maitra & Paul 2013); with HIGHECUT and BB; and with FDCUT and additional absorption feature (GAUS at EG = 10.2(5) keV with σG = 2.1(5) keV i.e. the same model as reported by Müller et al. 2012), are presented in Table 4.
We note that the CRSF parameters are consistent within uncertainties for all models. The cyclotron line parameters are significantly constrained in the first of the BeppoSAX observations. The feature is required also for the second observation, however, the line width becomes unconstrained. Following Maitra & Paul (2013), who reported that the line remains narrow at fluxes comparable with the dimmest BeppoSAX observations, for the second observation we fixed the line width to the same value of the first observation, which resulted in slightly higher value of the CRSF energy Ecyc = 41(2) keV.
We have also performed pulse-phase resolved analysis for the brightest observation. To describe the phase resolved spectra, we used a HIGHECUT model, modified by partial covering or blackbody. We have found that at lower counting statistics the parameters of the CRSF are better constrained when the additional blackbody component is used.
Taking into account the observed pulse profile morphology and significant statistics, we divided the data in five phase bins. In the case with the BB we fixed the absorption, energy and width of the emission iron and cyclotron lines and the temperature of the blackbody component at the average values. The phase dependence of the best fit parameters is shown in Fig. 7. It is interesting to note that the depth of the cyclotron feature becomes consistent with zero at the first pulse phases, meaning that the CRSF is statistically not significant. In fact, it is only significant in the soft peak of the pulse profile, even if the counting statistics is lower at this phase. We also note that the for the third phase bin the spectrum is consistent with a pure power law, so the additional soft component or partial covering are not required at this phase.
Parameters of the spectrum in 1998-10-09 with different description of the continuum: HIGHECUT + BB, HIGHECUT + PC and FDCUT + GAUS.
5. Discussion
In this paper we have analysed observations of XTE J1946+274 performed with BeppoSAX during the October–November 1998 outburst of the source. We found that the broadband spectrum of the source has a complex shape, which is not described adequately by the typically used phenomenological models, particularly in the energy region around ~10 keV. This is indeed in agreement with what reported by Müller et al. (2012) who, analysed observations of the 2010/2011 outburst of the source taken with INTEGRAL, RXTE, and Swift. Müller et al. (2012) accounted for the residuals around ~10 keV by including additional absorption line. However, based on the broadband spectra of accreting pulsars observed by BeppoSAX (see for example Robba et al. 2001; Doroshenko et al. 2015), we argue that residuals around 10 keV are due to an incorrect modelling of the entire continuum rather than to some local physical feature.
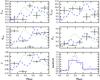 |
Fig. 7 Phase dependence of the spectral parameters for the brightest observation with HIGHECUT+BB model. Blue dashed and green dotted lines show for reference the MECS (2–10 keV) and PDS (15–120 keV) pulse profiles, scaled to match the respective parameter range. The lower right panel shows the hardness ratio for the same energy bands. |
In fact, following Maitra & Paul (2013) who analysed Suzaku observations of the 2010 outburst of the source, we successfully modelled the broadband BeppoSAX spectrum of XTE J1946+274 using an additional partial covering absorber in combination with the widely used phenomenological model HIGHECUT. This implies that part of the emission is absorbed within the binary system. To obtain a statistically acceptable fit, a more elaborate modelling of the soft X-ray absorption has been used by Marcu-Cheatham et al. (2015), who, analysing a Suzaku observation of the source at lower luminosity, considered absorption by different components of the ISM.
In our analysis we have found evidence of a cyclotron line at ~38 keV. The observed line energy implies a value of the magnetic field of 3.3(1 + z) × 1012 G assuming Ecyc ≈ 11.56 B12/ (1 + z), where z is the gravitational redshift of the scattering region. As seen in Table 4, our result is independent of the continuum model used.
Our finding is consistent within 3-sigma with the value reported by Heindl et al. (2001) on the basis of RXTE data of the same outburst, but at the higher luminosity. Our result is also in agreement with the value of the CRSF energy reported by Maitra & Paul (2013) with the Suzaku. We note, that the considered BeppoSAX observation had been performed at significantly higher luminosity, than the Suzaku observations. So there appears to be no strong correlation of the CRSF centroid energy with luminosity. On the other hand, the centroid of the not very significant (~2.8σ) line at ~35 keV reported by Marcu-Cheatham et al. (2015) is slightly lower. In our analysis we do not find evidence of any line at ~25 keV as suggested by Müller et al. (2012), even if we use the same continuum used by Müller et al. (2012). Since the source had comparable luminosity in the two observations, the reason for such a dramatic change is unclear. Conversely, Müller et al. (2012) report that they finds two alternative fit solutions with lines at ~30 and ~40 keV, and while the solution with a line at 25 keV is most significant of the three, its significance remains low at ≤2σ.
A suggestion of the CRSF being located at 38 keV follows from the pulsed fraction energy dependance which exhibits a feature around ~40 keV (see Fig. 5). Although the feature is marginally significant, we observe that a similar behaviour has also been observed in other sources and can be associated with change of the pulsar beam pattern around the resonance energy (Ferrigno et al. 2009; Schönherr et al. 2014).
We have also carried out the pulse-phase resolved analysis for the brightest BeppoSAX observation. Surprisingly, the CRSF is only detected at certain pulse phases, namely in the second peak of the two peaked pulse profile. The statistical quality of the phase-resolved spectra is comparable in all phase bins, so the feature does indeed change intensity and energy with pulse phase. This could be understood considering again the pulse profiles of the source.
As already discussed, the pulse profiles observed by BeppoSAX strongly evolve with the energy (see Fig. 3). The two peaks are separated by about half a phase, and, therefore, likely represent two emission components with roughly orthogonal beam patterns. Paul et al. (2001) suggested that the two peaks might be related to the emission from the two poles of the neutron star not diametrically positioned to each other. On the other hand, the pulse profile evolution, and in particular the ~180° phase shift between the soft and hard peaks can be qualitatively explained in terms of simultaneous presence of a “hard pencil” (aligned with cylindrical symmetry about the dipole axis) and a “soft fan” (cylindrically symmetric around the axis perpendicular to the dipole axis) beam components (Woo et al. 1996). Provided that Θ + Φ < 90° (Θ is the inclination of the spin axis, Φ is the angle between the spin and dipole axis) a single-peak pulse profile is produced by either pencil and fan beams.
The absence of the CRSF at certain phases might be explained, therefore, if only one of the components exhibits a CRSF in its spectrum. A similar scenario is realised in the model proposed by Poutanen et al. (2013) where reflection off the surface of the neutron star is responsible for CRSF formation. Here we would like to note that the reflected component is likely to be softer than incident emission, and the CRSF in XTE J1946+274 is only detected in soft peak. The fact that the CRSF parameters remain essentially unchanged despite an order of magnitude change in luminosity, which was already noted previously by Marcu-Cheatham et al. (2015), also suggests that the CRSF shall be formed close to the surface of the neutron star, rather than in a tall accretion column. This can be either due to reflection, or simply because the source consistently accretes in the subcritical regime as suggested by Marcu-Cheatham et al. (2015). A detailed modelling of the pulse profile, X-ray continuum and CRSF formation is required to move from the suggested qualitative interpretation to unambiguous and quantitative description of the observed phase and luminosity of the spectrum. This modelling must take into account several effects, from local beam pattern formation to propagation to the observer, which includes gravitational light bending. This is, however, an extremely complex task (Kraus 2001; Kraus et al. 2003; Sasaki et al. 2012) which is out of the scope of the present paper.
Acknowledgments
Authors thank the anonymous referee for the helpful comments. This work is partially supported by the Bundesministerium für Wirtschaft und Technologie through the Deutsches Zentrum für Luft- und Raumfahrt e.V. (DLR) under the grant numbers 50 OG 1301, 50 OR 1310.
References
- Arnaud, K., Dorman, B., & Gordon, C. 1999, Astrophysics Source Code Library, 10005 [Google Scholar]
- Boella, G., Butler, R. C., Perola, G. C., et al. 1997a, A&AS, 122, 299 [NASA ADS] [CrossRef] [EDP Sciences] [Google Scholar]
- Boella, G., Chiappetti, L., Conti, G., et al. 1997b, A&AS, 122, 327 [NASA ADS] [CrossRef] [EDP Sciences] [Google Scholar]
- Caballero, I., Pottschmidt, K., Bozzo, E., et al. 2010, ATel, 2692, 1 [NASA ADS] [Google Scholar]
- Caballero, I., Pottschmidt, K., Marcu, D. M., et al. 2013, ApJ, 764, L23 [NASA ADS] [CrossRef] [Google Scholar]
- Campana, S., Israel, G. L., Stella, L., & Santangelo, A. 1998, IAU Circ., 7039, 2 [NASA ADS] [Google Scholar]
- Campana, S., Israel, G., & Stella, L. 1999, A&A, 352, L91 [NASA ADS] [Google Scholar]
- Coburn, W., Heindl, W. A., Rothschild, R. E., et al. 2002, ApJ, 580, 394 [NASA ADS] [CrossRef] [Google Scholar]
- Doroshenko, R., Santangelo, A., Doroshenko, V., Suleimanov, V., & Piraino, S. 2015, MNRAS, 452, 2490 [NASA ADS] [CrossRef] [Google Scholar]
- Ferrigno, C., Becker, P. A., Segreto, A., Mineo, T., & Santangelo, A. 2009, A&A, 498, 825 [NASA ADS] [CrossRef] [EDP Sciences] [Google Scholar]
- Finger, M. H. 2010, ATel, 2847, 1 [NASA ADS] [Google Scholar]
- Frontera, F., Costa, E., dal Fiume, D., et al. 1997, A&AS, 122, 357 [Google Scholar]
- Heindl, W. A., Coburn, W., Gruber, D. E., et al. 2001, ApJ, 563, L35 [NASA ADS] [CrossRef] [Google Scholar]
- Hemphill, P. B., Rothschild, R. E., Caballero, I., et al. 2013, ApJ, 777, 61 [NASA ADS] [CrossRef] [Google Scholar]
- Jager, R., Mels, W. A., Brinkman, A. C., et al. 1997, A&AS, 125, 557 [NASA ADS] [CrossRef] [EDP Sciences] [Google Scholar]
- Kraus, U. 2001, ApJ, 563, 289 [NASA ADS] [CrossRef] [Google Scholar]
- Kraus, U., Zahn, C., Weth, C., & Ruder, H. 2003, ApJ, 590, 424 [NASA ADS] [CrossRef] [Google Scholar]
- Krimm, H. A., Barthelmy, S. D., Baumgartner, W., et al. 2010, ATel, 2663, 1 [NASA ADS] [Google Scholar]
- Maitra, C., & Paul, B. 2013, ApJ, 771, 96 [NASA ADS] [CrossRef] [Google Scholar]
- Makishima, K., Mihara, T., Nagase, F., & Tanaka, Y. 1999, ApJ, 525, 978 [NASA ADS] [CrossRef] [Google Scholar]
- Manzo, G., Giarrusso, S., Santangelo, A., et al. 1997, A&AS, 122, 341 [NASA ADS] [CrossRef] [EDP Sciences] [Google Scholar]
- Marcu-Cheatham, D. M., Pottschmidt, K., Kühnel, M., et al. 2015, ApJ, 815, 44 [NASA ADS] [CrossRef] [Google Scholar]
- Mihara, T. 1995, Ph.D. Thesis, Dept. of Physics, Univ. of Tokyo, 215 (M95) [Google Scholar]
- Müller, S., Kühnel, M., Caballero, I., et al. 2012, A&A, 546, A125 [NASA ADS] [CrossRef] [EDP Sciences] [Google Scholar]
- Parmar, A. N., Martin, D. D. E., Bavdaz, M., et al. 1997, A&AS, 122, 309 [NASA ADS] [CrossRef] [EDP Sciences] [Google Scholar]
- Paul, B., Agrawal, P. C., Mukerjee, K., et al. 2001, A&A, 370, 529 [NASA ADS] [CrossRef] [EDP Sciences] [Google Scholar]
- Poutanen, J., Mushtukov, A. A., Suleimanov, V. F., et al. 2013, ApJ, 777, 115 [NASA ADS] [CrossRef] [Google Scholar]
- Robba, N. R., Burderi, L., Di Salvo, T., Iaria, R., & Cusumano, G. 2001, ApJ, 562, 950 [NASA ADS] [CrossRef] [Google Scholar]
- Sasaki, M., Müller, D., Kraus, U., Ferrigno, C., & Santangelo, A. 2012, A&A, 540, A35 [NASA ADS] [CrossRef] [EDP Sciences] [Google Scholar]
- Schönherr, G., Schwarm, F.-W., Falkner, S., et al. 2014, A&A, 564, L8 [NASA ADS] [CrossRef] [EDP Sciences] [Google Scholar]
- Smith, D. A., & Takeshima, T. 1998a, IAU Circ., 7014, 1 [NASA ADS] [Google Scholar]
- Smith, D. A., & Takeshima, T. 1998b, ATel, 36, 1 [NASA ADS] [Google Scholar]
- Tanaka, Y. 1986, in Radiation Hydrodynamics in Stars and Compact Objects, eds. D. Mihalas, & K.-H. A. Winkler (Berlin: Springer Verlag), IAU Colloq., 89, Lect. Notes Phys., 255, 198 [Google Scholar]
- Titarchuk, L. 1994, ApJ, 434, 570 [NASA ADS] [CrossRef] [Google Scholar]
- Verrecchia, F., Israel, G. L., Negueruela, I., et al. 2002, A&A, 393, 983 [NASA ADS] [CrossRef] [EDP Sciences] [Google Scholar]
- White, N. E., Swank, J. H., & Holt, S. S. 1983, ApJ, 270, 711 [NASA ADS] [CrossRef] [Google Scholar]
- Wilson, C. A., Finger, M. H., Wilson, R. B., & Scott, D. M. 1998, IAU Circ., 7014, 2 [NASA ADS] [Google Scholar]
- Wilson, C. A., Finger, M. H., Coe, M. J., & Negueruela, I. 2003, ApJ, 584, 996 [NASA ADS] [CrossRef] [Google Scholar]
- Woo, J. W., Clark, G. W., Levine, A. M., Corbet, R. H. D., & Nagase, F. 1996, ApJ, 467, 811 [NASA ADS] [CrossRef] [Google Scholar]
All Tables
Variation parameters of XTE J1946+274 with flux, during decay of the 1998 yr outburst observed by BeppoSAX with HIGHECUT+BB continuum model.
Parameters of the spectrum in 1998-10-09 with different description of the continuum: HIGHECUT + BB, HIGHECUT + PC and FDCUT + GAUS.
All Figures
|
Fig. 1 Light curve of XTE J1946+274 as observed by RXTE/ASM. Dashed lines are BeppoSAX observations. |
| In the text | |
|
Fig. 2 XTE J1946+274 pulse period as observed by BeppoSAX. Uncertainties errors are given with 1σ confidence level (for the most points errors are inside the circles). |
| In the text | |
|
Fig. 3 Pulse profiles of XTE J1946+274 in 11 energy bands observed with the BeppoSAX satellite by LECS, MECS, HPGSPC and PDS instruments in 9th of October, 1998. |
| In the text | |
|
Fig. 4 Luminosity dependence of the soft (MECS data in 2–10 keV range, black points), and hard (PDS data in 20–40 keV, red crosses) normalised pulse profiles along the outburst. |
| In the text | |
|
Fig. 5 XTE J1946+274 pulse fraction for the brightest BeppoSAX observation in 10-09-1998. The emission feature is around cyclotron line energy, Ecyc ~ 38 keV. |
| In the text | |
|
Fig. 6 Unfolded spectrum XTE J1946+274 on 1998-10-09 fitted with HIGHECUT+BB continuum model (top panel). The middle and bottom panels show best-fit residuals without and with inclusion of iron and cyclotron lines respectively. |
| In the text | |
|
Fig. 7 Phase dependence of the spectral parameters for the brightest observation with HIGHECUT+BB model. Blue dashed and green dotted lines show for reference the MECS (2–10 keV) and PDS (15–120 keV) pulse profiles, scaled to match the respective parameter range. The lower right panel shows the hardness ratio for the same energy bands. |
| In the text | |
Current usage metrics show cumulative count of Article Views (full-text article views including HTML views, PDF and ePub downloads, according to the available data) and Abstracts Views on Vision4Press platform.
Data correspond to usage on the plateform after 2015. The current usage metrics is available 48-96 hours after online publication and is updated daily on week days.
Initial download of the metrics may take a while.