Free Access
Fig. 6
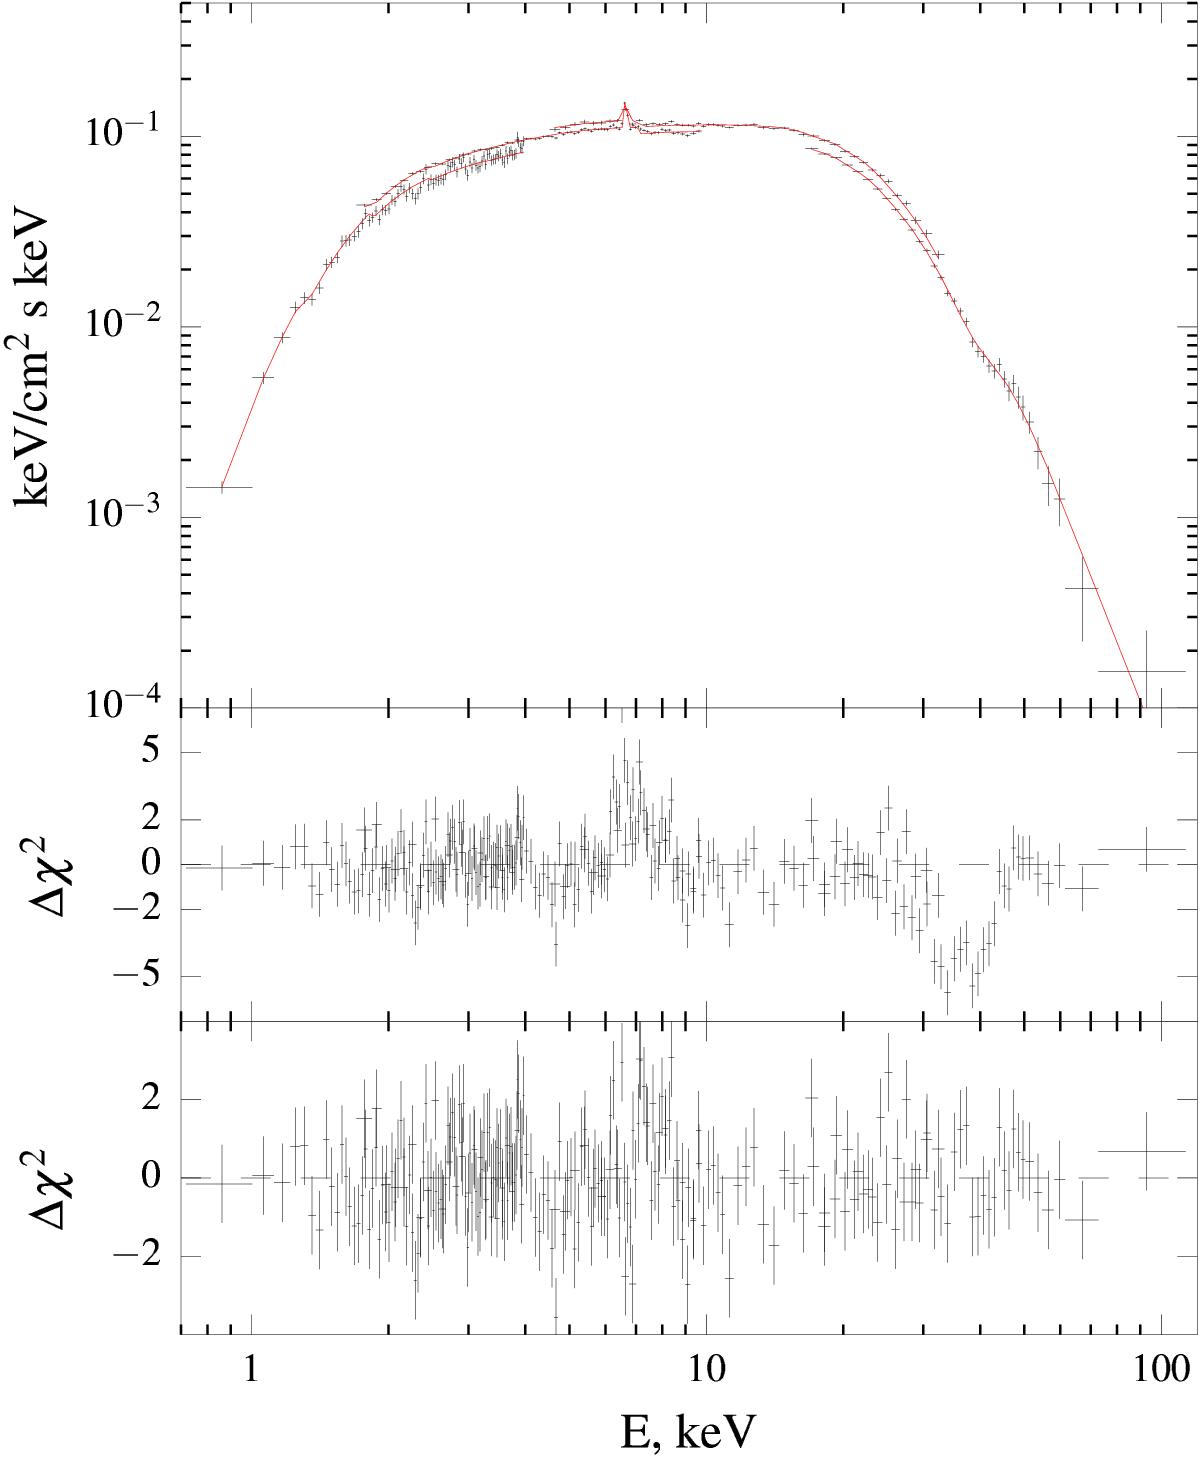
Unfolded spectrum XTE J1946+274 on 1998-10-09 fitted with HIGHECUT+BB continuum model (top panel). The middle and bottom panels show best-fit residuals without and with inclusion of iron and cyclotron lines respectively.
Current usage metrics show cumulative count of Article Views (full-text article views including HTML views, PDF and ePub downloads, according to the available data) and Abstracts Views on Vision4Press platform.
Data correspond to usage on the plateform after 2015. The current usage metrics is available 48-96 hours after online publication and is updated daily on week days.
Initial download of the metrics may take a while.