Fig. 6
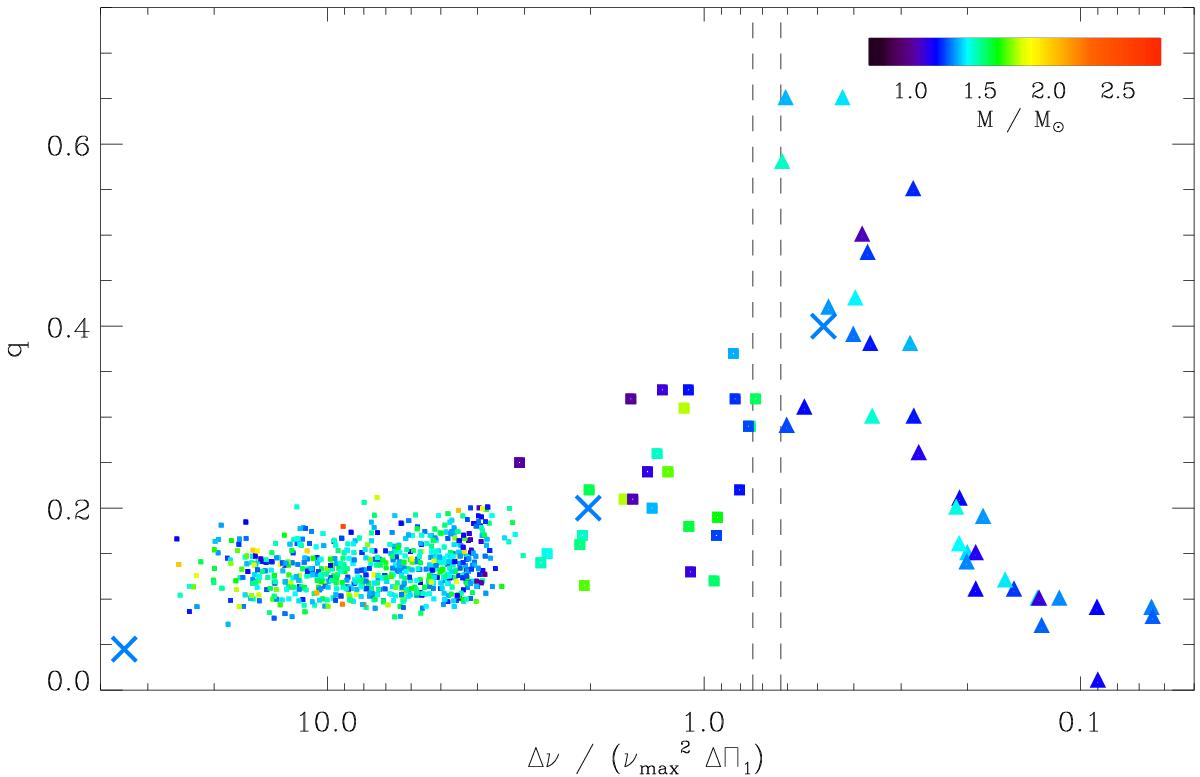
Coupling factor q as a function of the mixed-mode density ![]() . The vertical dashed lines indicate the transition from subgiants to red giants defined by Mosser et al. (2014). Triangles indicate subgiants; squares indicate stars on the RGB (small squares for long-cadence Kepler data and big squares for short-cadence data). Three values of q obtained for a synthetic 1.3-M⊙ evolutionary sequence are also shown with × (see Sect. 5.3 and Table 3).
. The vertical dashed lines indicate the transition from subgiants to red giants defined by Mosser et al. (2014). Triangles indicate subgiants; squares indicate stars on the RGB (small squares for long-cadence Kepler data and big squares for short-cadence data). Three values of q obtained for a synthetic 1.3-M⊙ evolutionary sequence are also shown with × (see Sect. 5.3 and Table 3).
Current usage metrics show cumulative count of Article Views (full-text article views including HTML views, PDF and ePub downloads, according to the available data) and Abstracts Views on Vision4Press platform.
Data correspond to usage on the plateform after 2015. The current usage metrics is available 48-96 hours after online publication and is updated daily on week days.
Initial download of the metrics may take a while.