Fig. 3
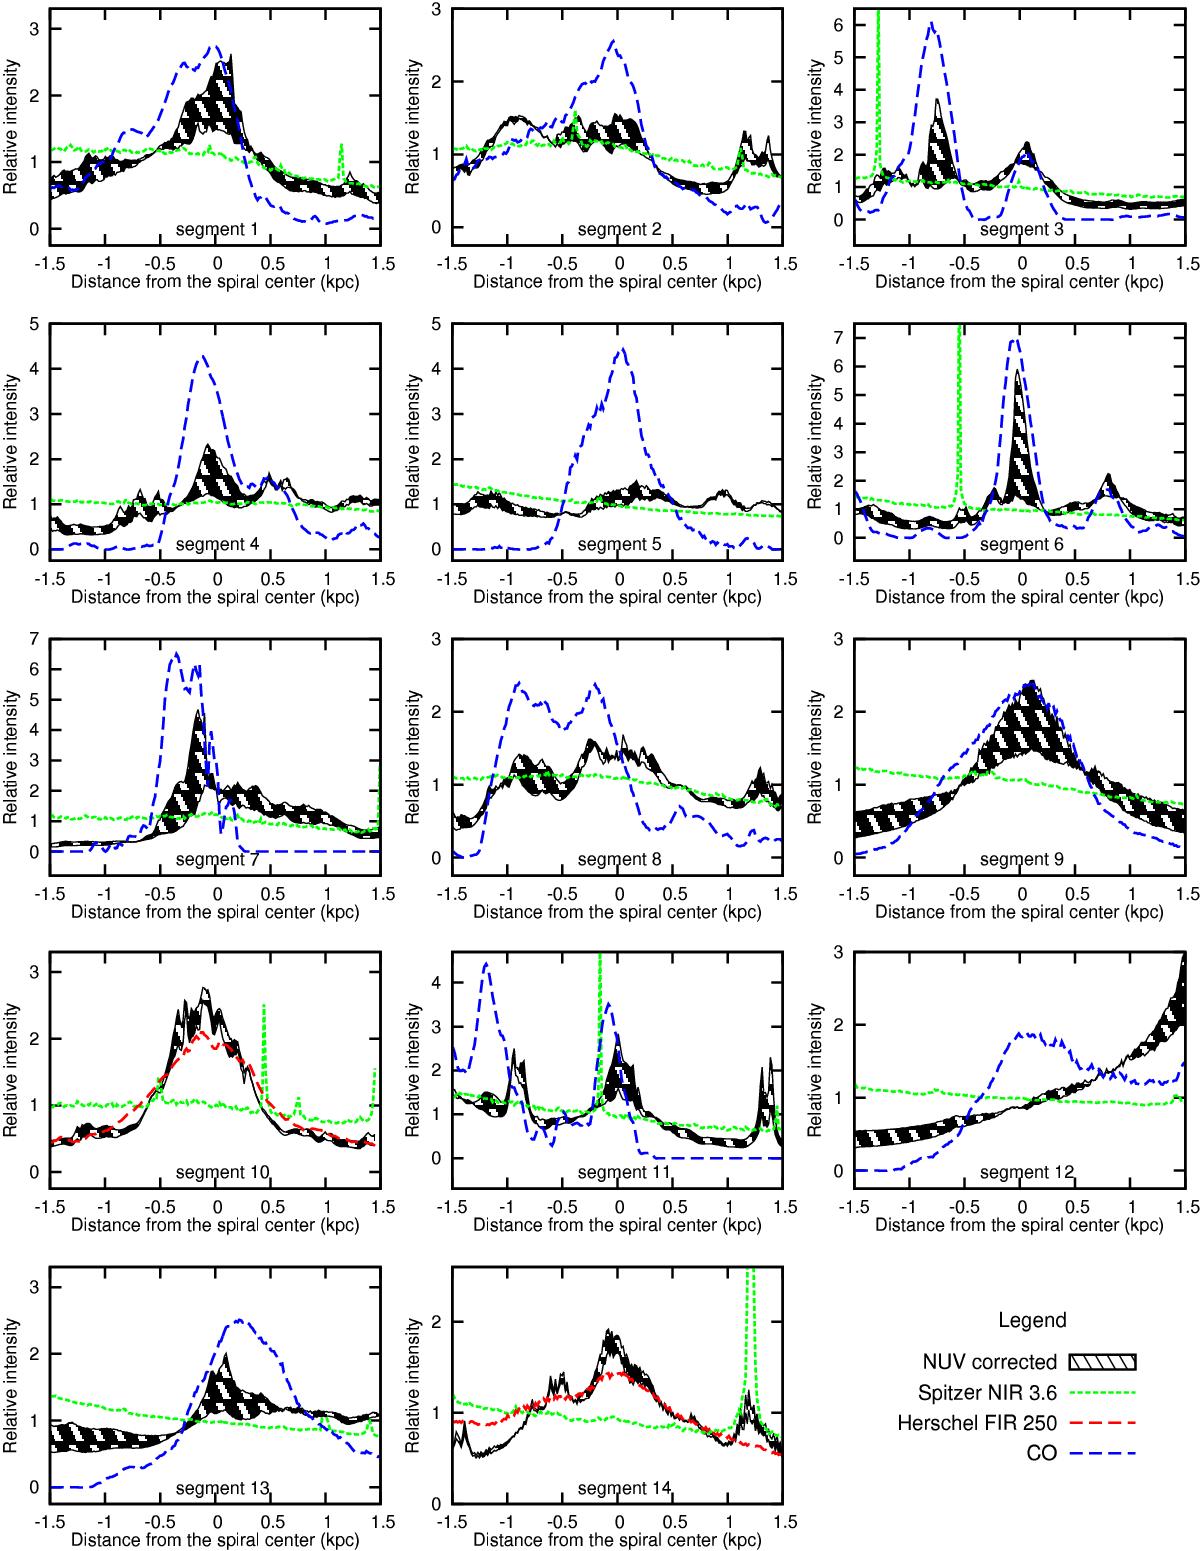
Cross sections of CO emission (or FIR 250 μm emission), extinction-corrected GALEX NUV emission (young stars with a mean age of 10 Myr; the hatched region corresponds to lower and upper limits of extinction) and Spitzer 3.6 μm NIR emission (characterising the overall stellar mass distribution) for the spiral segments. The horizontal axis shows the distance from the spine of the given spiral segment. Negative distances correspond to the inner side of a segment (closer to the galactic centre). The vertical axis shows the relative intensity of the corresponding star formation tracer. Narrow peaks in NIR emission distributions are due to local stars.
Current usage metrics show cumulative count of Article Views (full-text article views including HTML views, PDF and ePub downloads, according to the available data) and Abstracts Views on Vision4Press platform.
Data correspond to usage on the plateform after 2015. The current usage metrics is available 48-96 hours after online publication and is updated daily on week days.
Initial download of the metrics may take a while.