Fig. 1
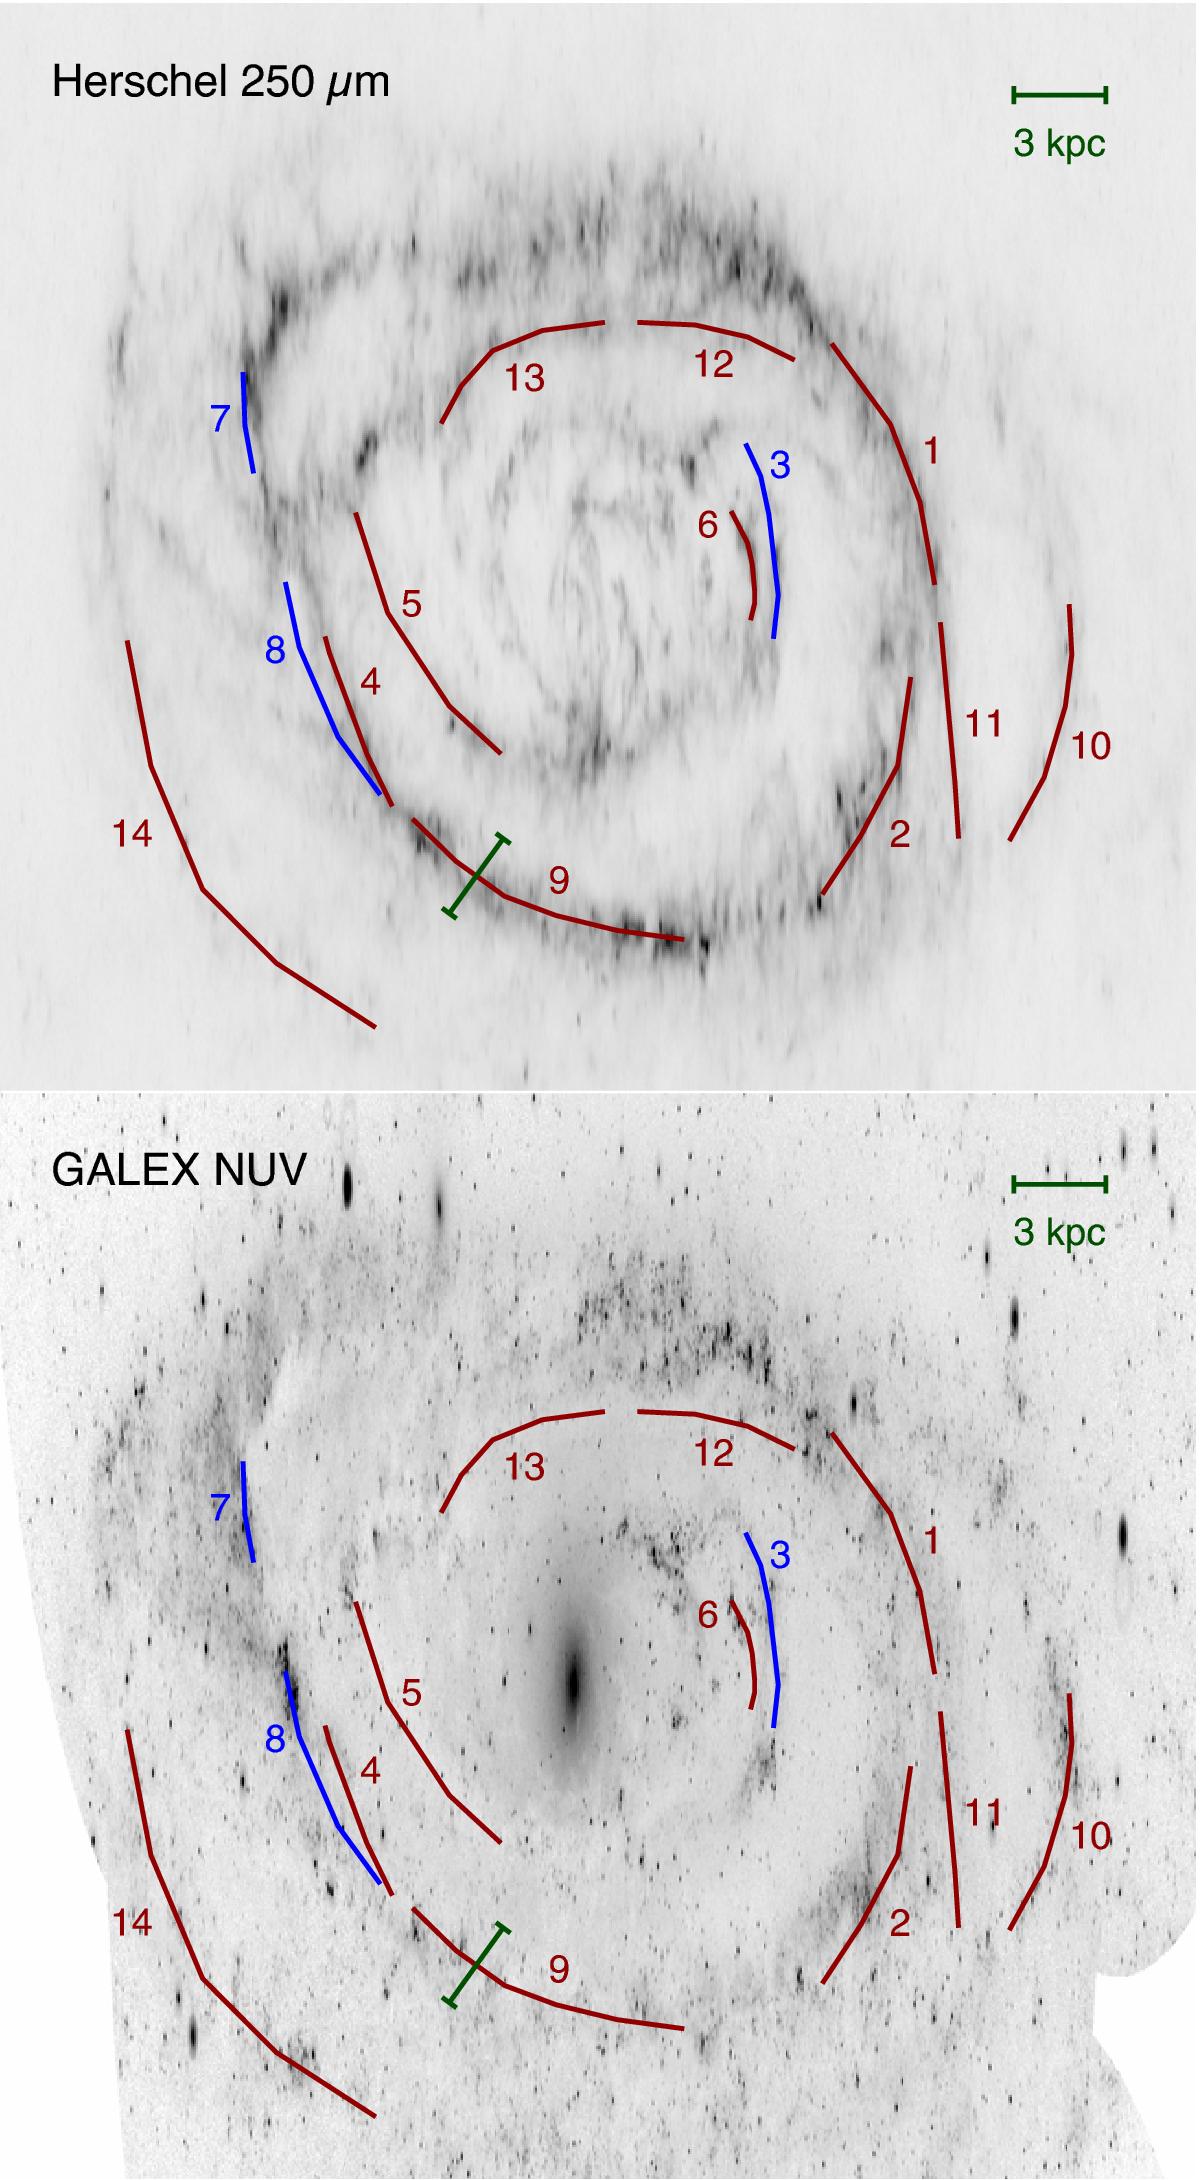
De-projected Herschel FIR emission map (upper panel) and GALEX NUV emission map (lower panel) of M 31, overlaid with the studied segments. Segments 3, 7 and 8 (blue curves) were defined on the basis of the NUV emission map, the other segments (red curves) from the FIR map. Emission along the segments was integrated, yielding the mean cross section (profiles) of each segment. The width of the cross sections (marked with green line for segment 9) is 3 kpc for all segments.
Current usage metrics show cumulative count of Article Views (full-text article views including HTML views, PDF and ePub downloads, according to the available data) and Abstracts Views on Vision4Press platform.
Data correspond to usage on the plateform after 2015. The current usage metrics is available 48-96 hours after online publication and is updated daily on week days.
Initial download of the metrics may take a while.