Fig. 7
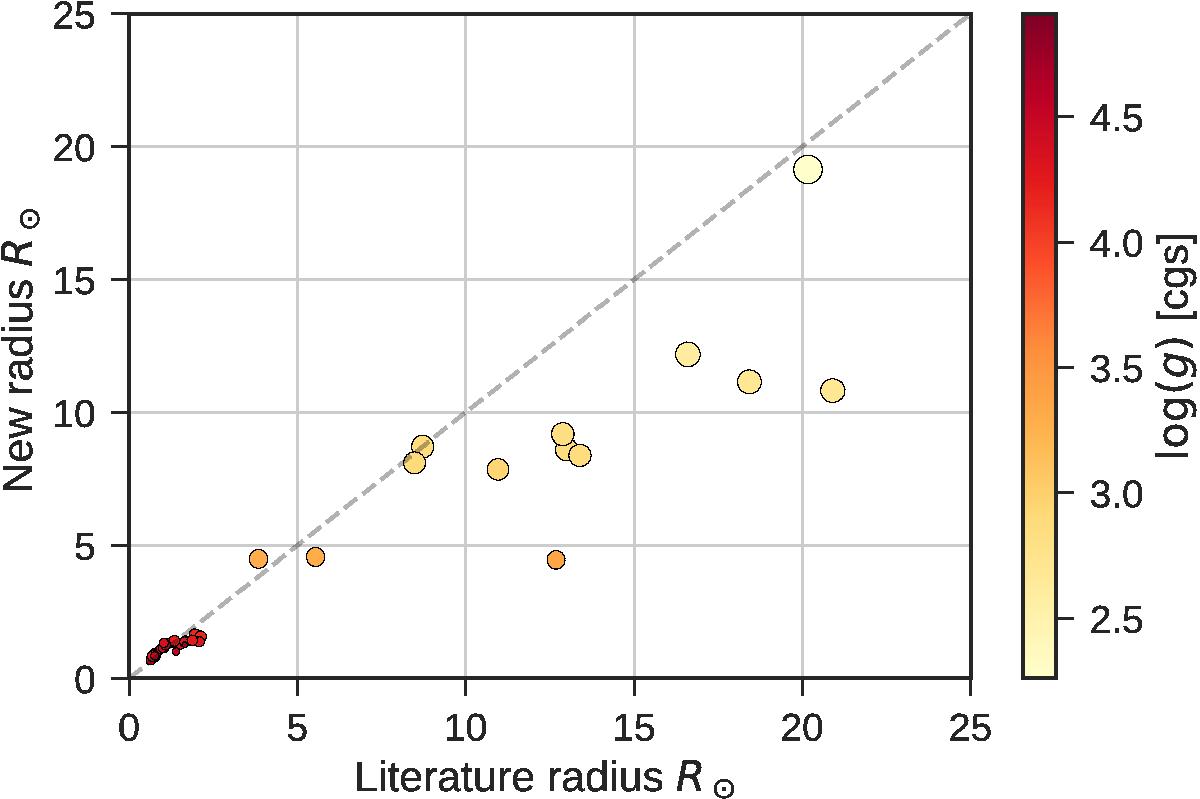
Stellar radius on both axes calculated based on Torres et al. (2010). The x-axis shows the stellar radius based on the atmospheric parameters from the literature, while the y-axis indicates the new homogeneous parameters presented here. The colour and size indicate the surface gravity. This clearly shows that the disagreement is biggest for more evolved stars.
Current usage metrics show cumulative count of Article Views (full-text article views including HTML views, PDF and ePub downloads, according to the available data) and Abstracts Views on Vision4Press platform.
Data correspond to usage on the plateform after 2015. The current usage metrics is available 48-96 hours after online publication and is updated daily on week days.
Initial download of the metrics may take a while.