Free Access
Fig. 3
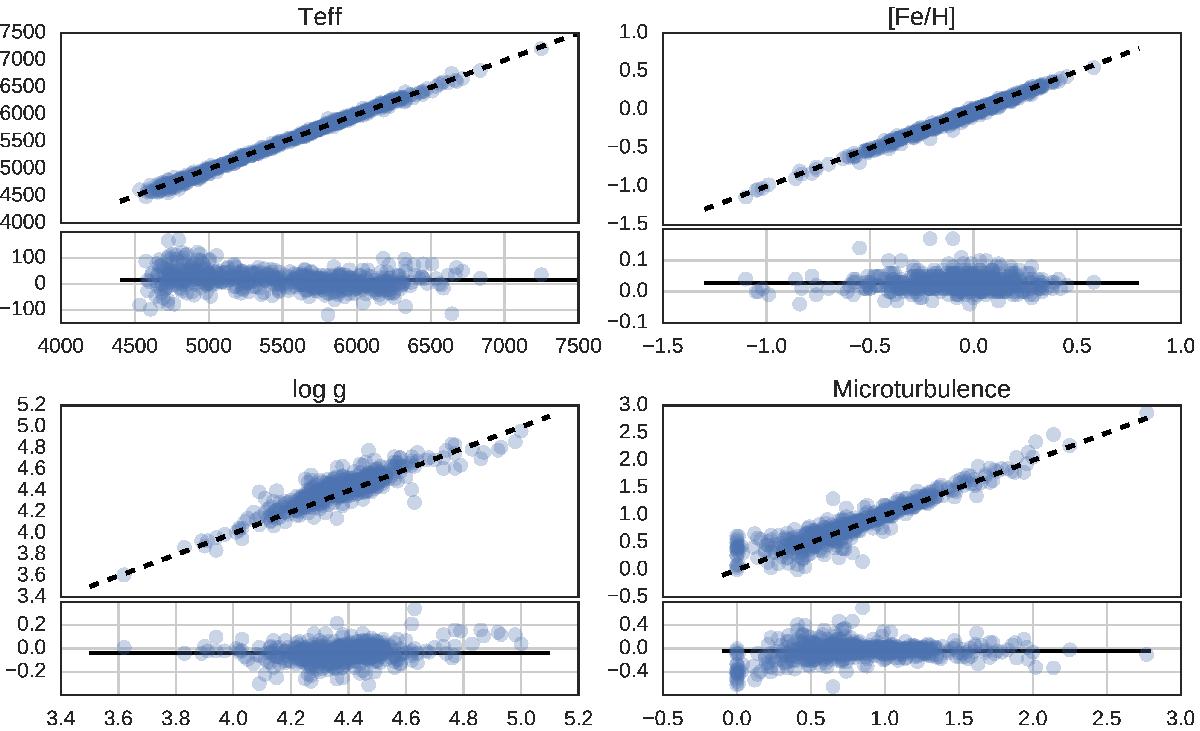
Stellar atmospheric parameters derived by FASMA compared to the sample by Sousa et al. (2011). The x-axis in all plots shows the results from FASMA, while the y-axis shows the parameters derived by Sousa et al. (2011).
Current usage metrics show cumulative count of Article Views (full-text article views including HTML views, PDF and ePub downloads, according to the available data) and Abstracts Views on Vision4Press platform.
Data correspond to usage on the plateform after 2015. The current usage metrics is available 48-96 hours after online publication and is updated daily on week days.
Initial download of the metrics may take a while.