Fig. A.1
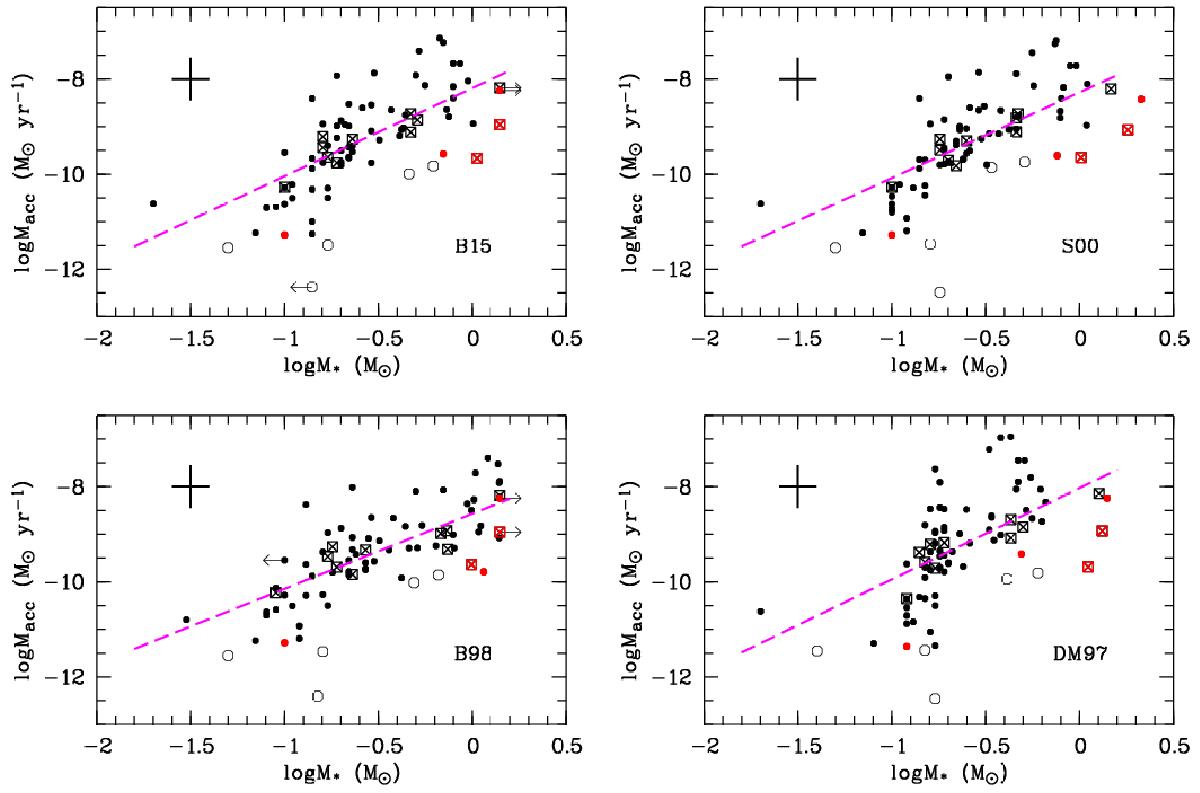
Mass accretion rate Ṁacc as a function of M⋆ in log scale as determined using the four different PMS evolutionary models described in Section A. The YSOs with transitional discs are distinguished with crossed squares, while the sub-luminous objects are shown with open circles. The low accretors are shown with red symbols (see Sect. B.1). The arrows show upper or lower limits on the mass according to the availability of the tracks in each model. Average errors are shown in the upper left of each panel. The purple dashed lines represent the corresponding linear fits as in Table A.1.
Current usage metrics show cumulative count of Article Views (full-text article views including HTML views, PDF and ePub downloads, according to the available data) and Abstracts Views on Vision4Press platform.
Data correspond to usage on the plateform after 2015. The current usage metrics is available 48-96 hours after online publication and is updated daily on week days.
Initial download of the metrics may take a while.