Fig. 8
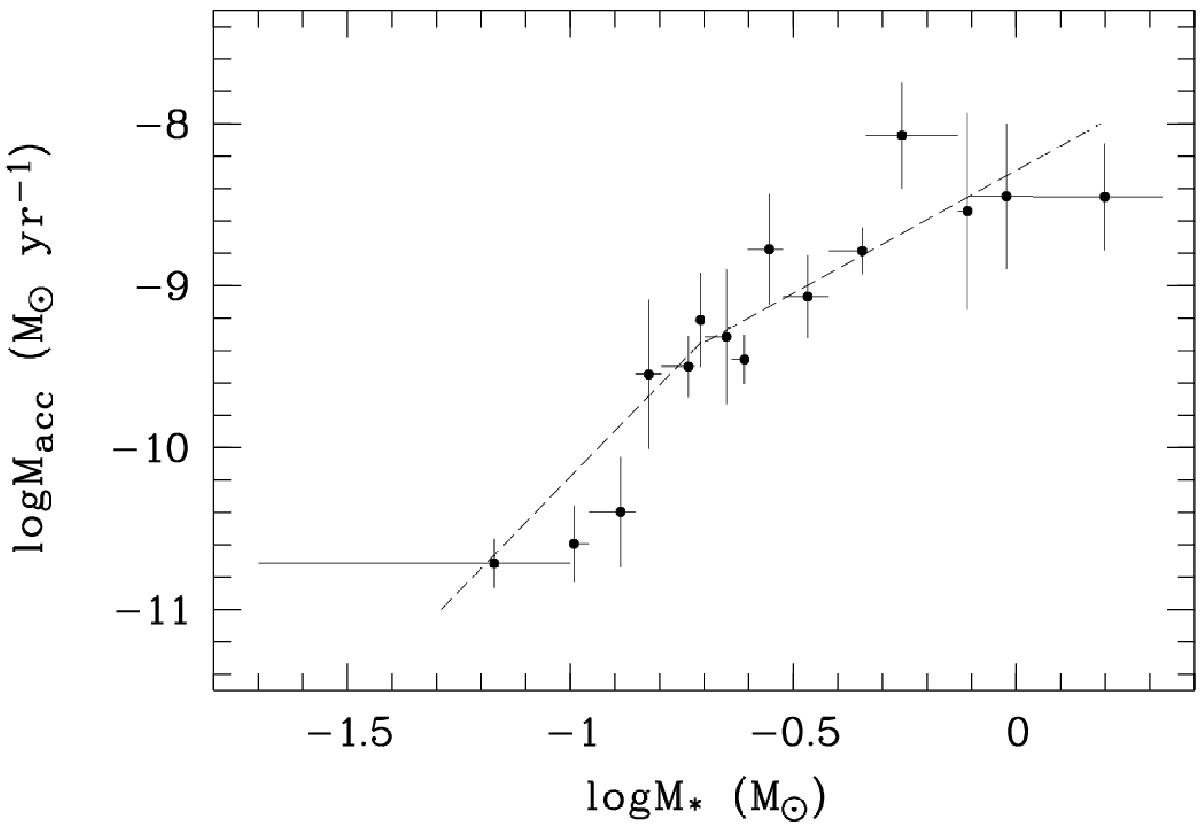
Median values of accretion rate as a function of binned stellar mass. Each point is the median of 5 Ṁacc values with similar M⋆. The plotting errors were computed in the same way as in Fig. 5. The horizontal bars represent the intervals in log M⋆. The dashed line shows the two power-law relationship by Vorobyov & Basu (2009), vertically shifted by −1 dex.
Current usage metrics show cumulative count of Article Views (full-text article views including HTML views, PDF and ePub downloads, according to the available data) and Abstracts Views on Vision4Press platform.
Data correspond to usage on the plateform after 2015. The current usage metrics is available 48-96 hours after online publication and is updated daily on week days.
Initial download of the metrics may take a while.