Fig. 6
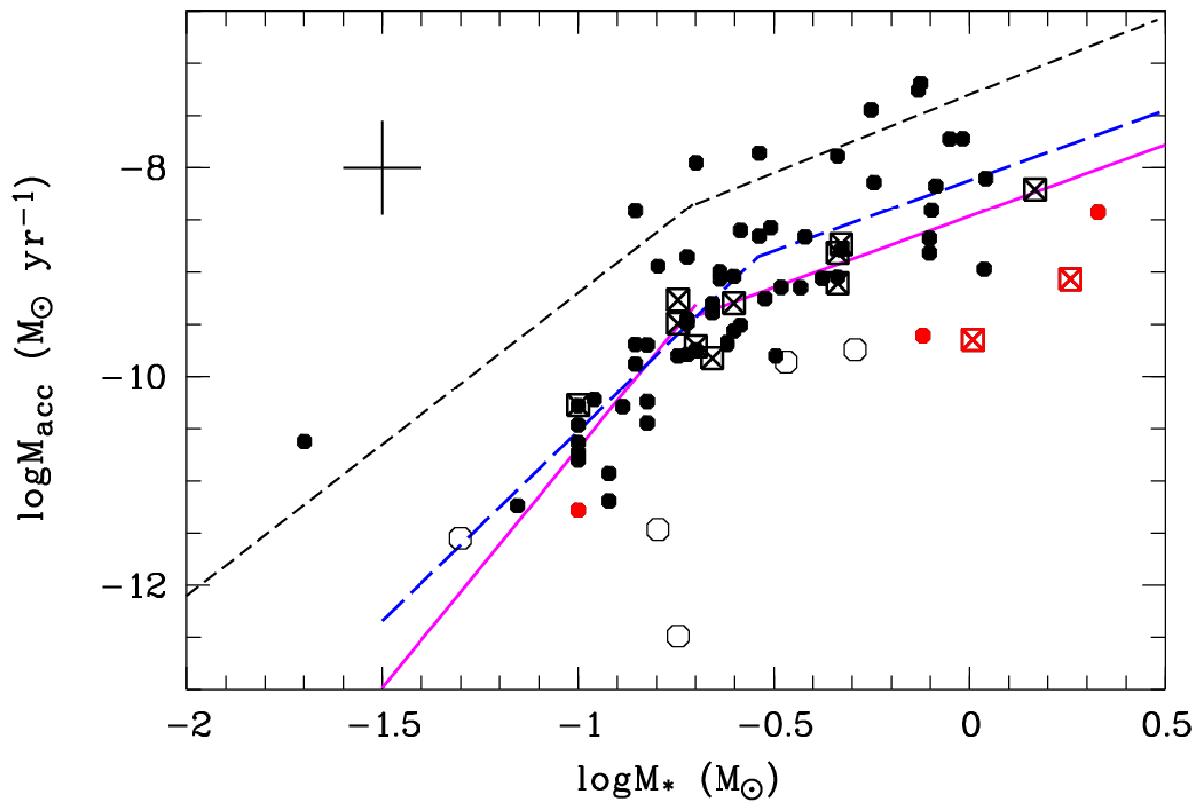
Mass accretion rate Ṁacc as a function of mass for the total sample in log scale. Plotting symbols are the same as in Fig. 4. The average errors in log M⋆ and log Ṁacc are shown in the upper left. The black dashed line shows the double power-law theoretically predicted by Vorobyov & Basu (2009). The continuous magenta lines represent the fits to the data as in Eqs. (4) and (5). The long-dashed blue line shows the robust double-linear fit following the prescription by Manara et al. (2017) as explained in the text.
Current usage metrics show cumulative count of Article Views (full-text article views including HTML views, PDF and ePub downloads, according to the available data) and Abstracts Views on Vision4Press platform.
Data correspond to usage on the plateform after 2015. The current usage metrics is available 48-96 hours after online publication and is updated daily on week days.
Initial download of the metrics may take a while.