Fig. 2
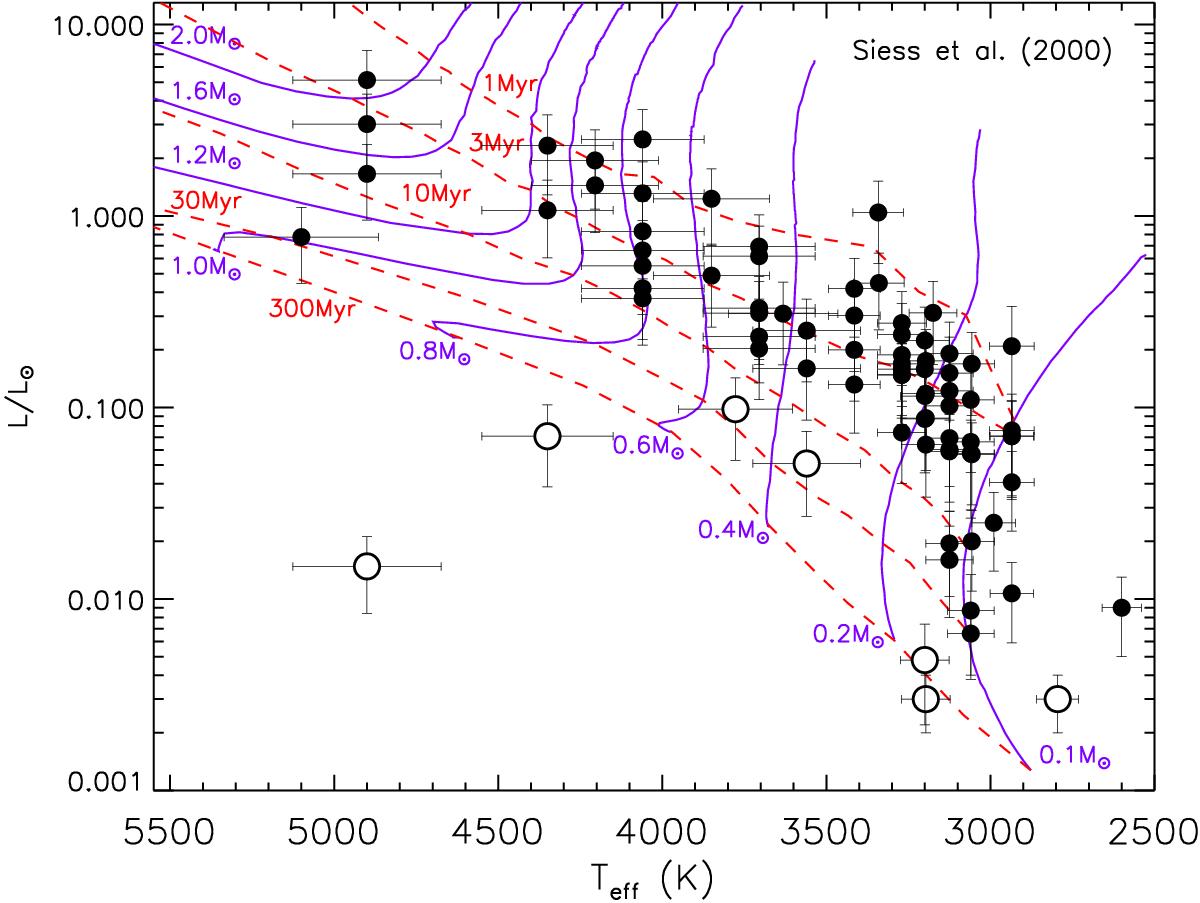
Hertzsprung-Russell diagram for the total sample. The GTO and new samples are represented with the black symbols. The seven sub-luminous objects described in the text are represented with open circles. The dashed lines show the isochrones, reported by Siess et al. (2000), while the continuous lines show the low-mass Pre-Main Sequence evolutionary tracks by the same authors as labelled.
Current usage metrics show cumulative count of Article Views (full-text article views including HTML views, PDF and ePub downloads, according to the available data) and Abstracts Views on Vision4Press platform.
Data correspond to usage on the plateform after 2015. The current usage metrics is available 48-96 hours after online publication and is updated daily on week days.
Initial download of the metrics may take a while.