Fig. B.1
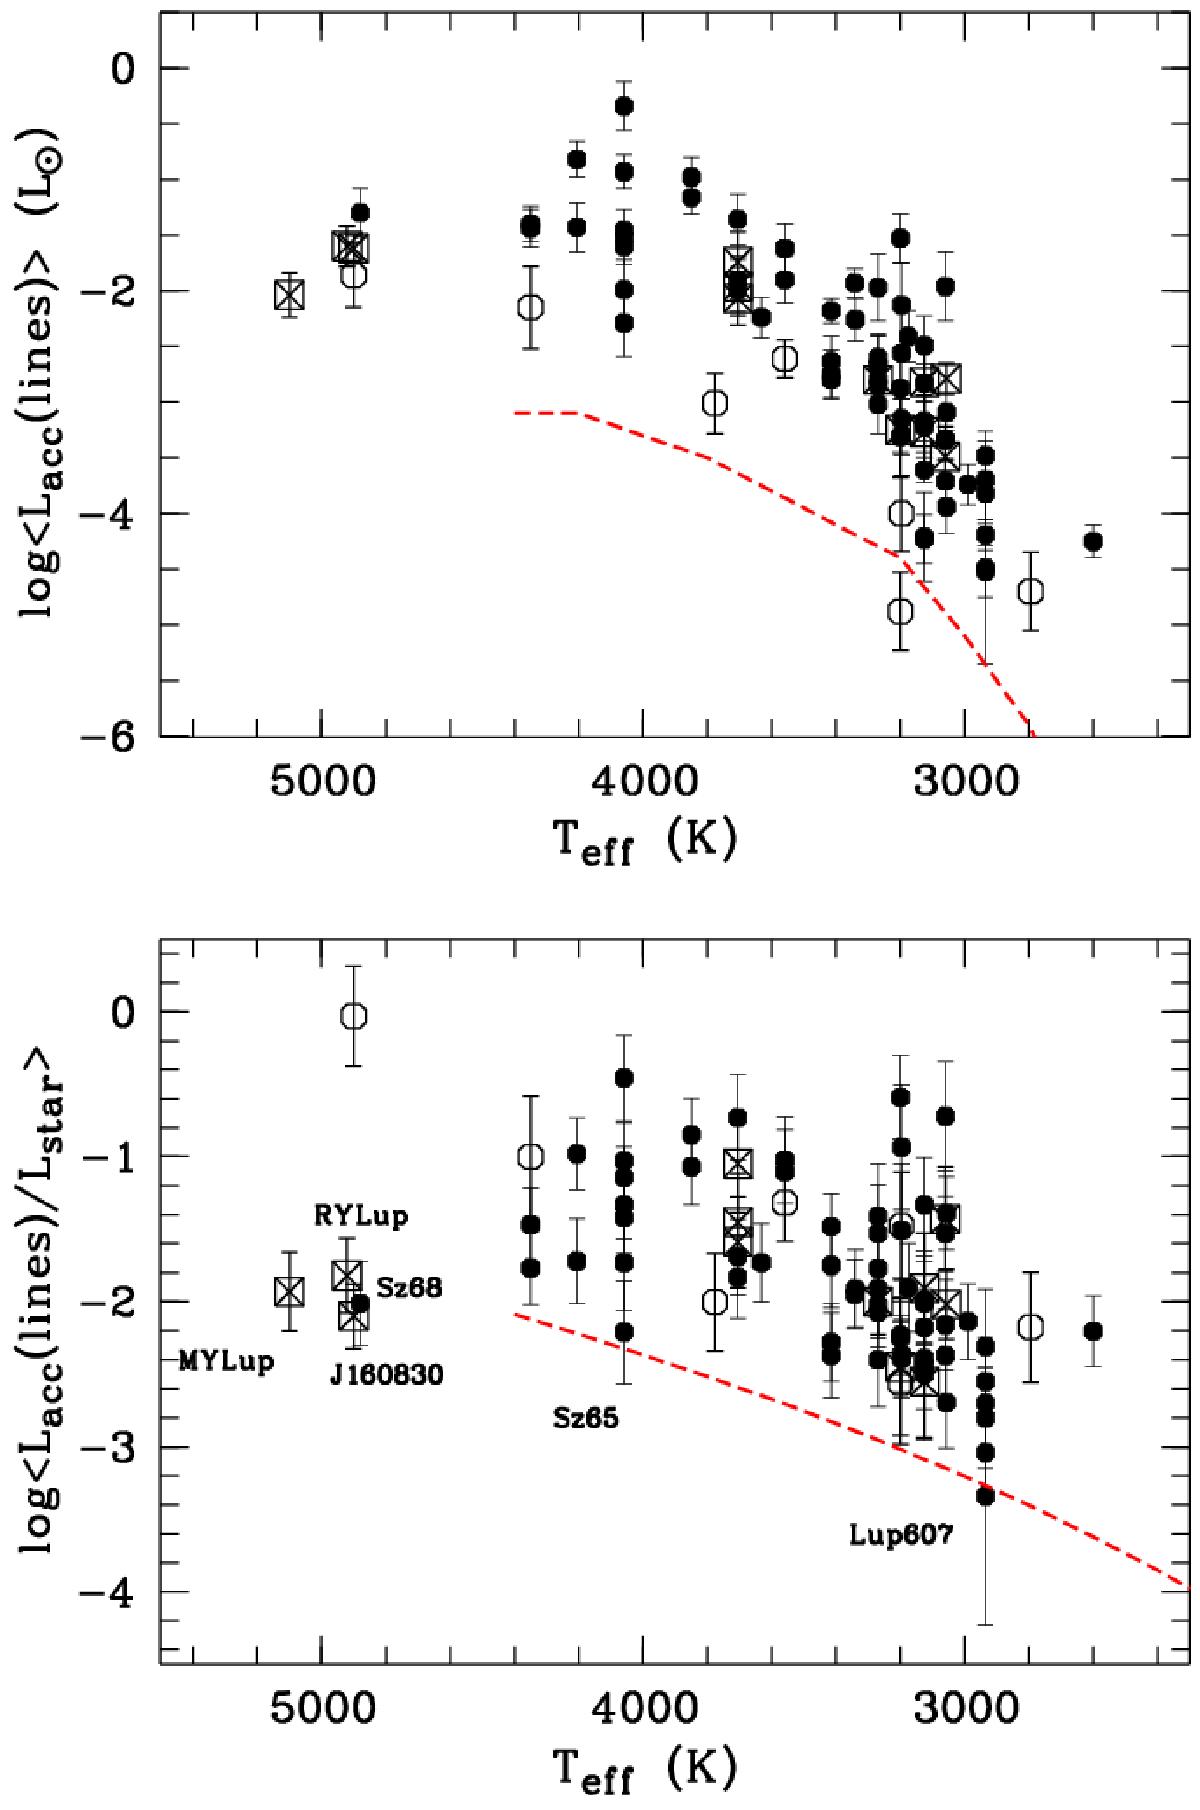
Average accretion luminosity ⟨Lacc(lines)⟩ derived from emission lines as described in the text (upper panel) and the ⟨Lacc(lines)/L⋆⟩ ratio (lower panel) in logarithmic scale as a function of effective temperature for the total sample. The objects with transitional discs are distinguished with crossed squares, while the sub-luminous objects are shown with open circles. The dashed lines in both panels mark the locus below which chromospheric emission is important in comparison with Lacc. The vertical error bars represent the standard deviation over the average. The weak accretors and RY Lup are labelled.
Current usage metrics show cumulative count of Article Views (full-text article views including HTML views, PDF and ePub downloads, according to the available data) and Abstracts Views on Vision4Press platform.
Data correspond to usage on the plateform after 2015. The current usage metrics is available 48-96 hours after online publication and is updated daily on week days.
Initial download of the metrics may take a while.