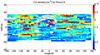
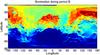
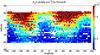
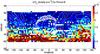
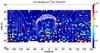
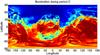
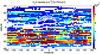
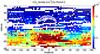
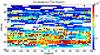
Fig. 8
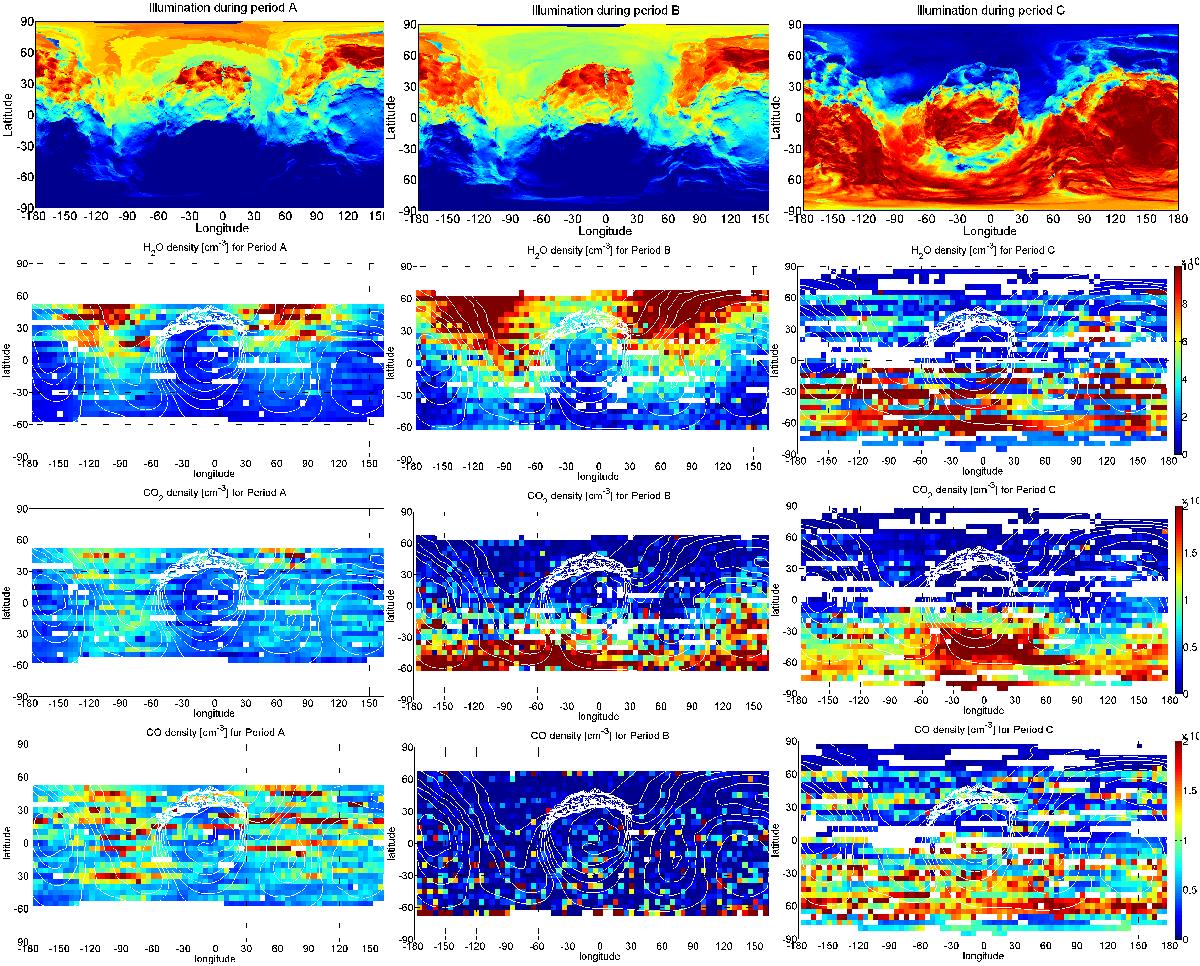
Maps of illumination and densities. Upper panels: left, middle, and right figures represent 2D longitude/latitude maps of average illumination during periods A/B/C. The corresponding 2D maps of H2O, CO2, and CO densities in cm-3 measured by RTOF (the second, third and fourth rows, respectively) normalized at 10 km with a 1/r2 scaling law, projected to the SSP longitude and latitude. The latitude 0 separates northern and southern hemispheres and topography lines;white contour lines in the maps are added on the maps based on the 3D shape model provided by ESA/Rosetta/MPS for OSIRIS Team MPS/UPD/LAM/IAA/SSO/INTA/UPM/DASP/IDA.
Current usage metrics show cumulative count of Article Views (full-text article views including HTML views, PDF and ePub downloads, according to the available data) and Abstracts Views on Vision4Press platform.
Data correspond to usage on the plateform after 2015. The current usage metrics is available 48-96 hours after online publication and is updated daily on week days.
Initial download of the metrics may take a while.