Free Access
Fig. 4
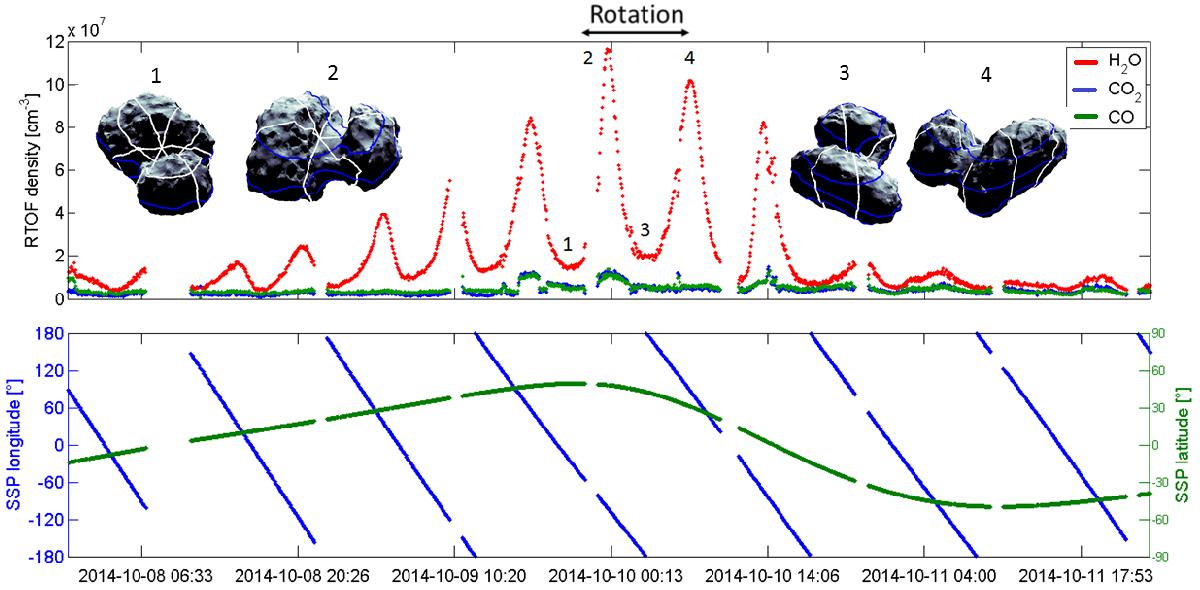
Diurnal variation of main volatiles. Upper panel: zoom of upper panel of Fig. 3 from 8 October to 11 October with the view of the comet from the spacecraft at specific times. Lower panel: sub-satellite point longitude and latitude variations during the same period.
Current usage metrics show cumulative count of Article Views (full-text article views including HTML views, PDF and ePub downloads, according to the available data) and Abstracts Views on Vision4Press platform.
Data correspond to usage on the plateform after 2015. The current usage metrics is available 48-96 hours after online publication and is updated daily on week days.
Initial download of the metrics may take a while.