Fig. 3
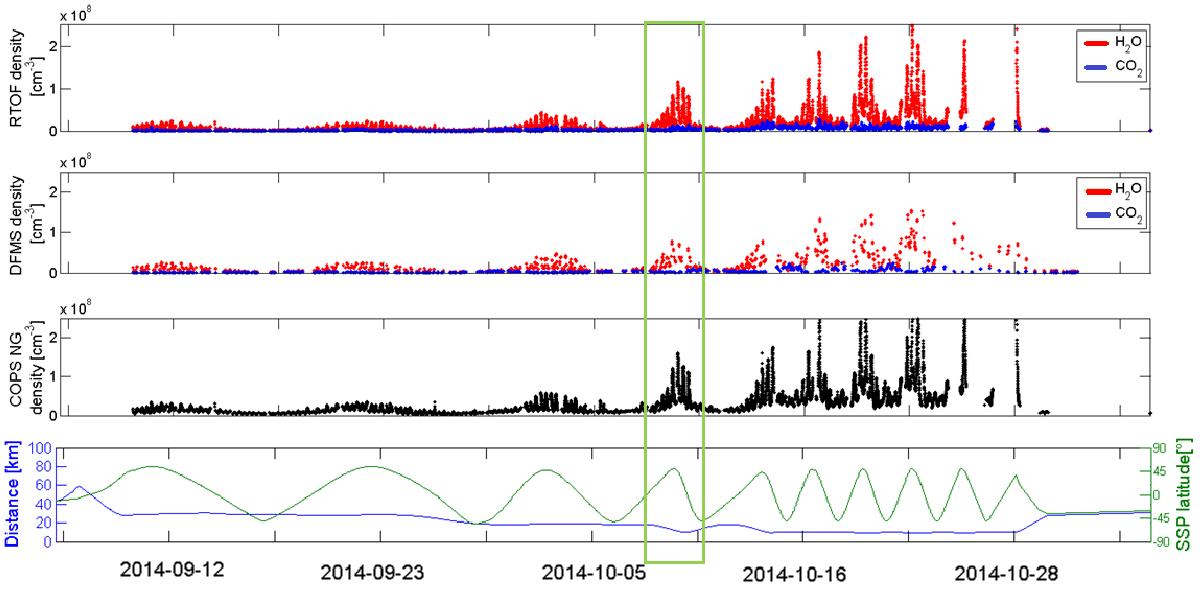
Measured densities for H2O (in red) and CO2 (in blue) by RTOF (upper panel) and DFMS (second panel) for period A. Third panel: COPS total density from the nude gauge. The lower panel provides the variation of the distance between the comet and the spacecraft in blue and the variation of the sub-satellite point latitude in green. A zoom of the green rectangle area is shown in the next figure.
Current usage metrics show cumulative count of Article Views (full-text article views including HTML views, PDF and ePub downloads, according to the available data) and Abstracts Views on Vision4Press platform.
Data correspond to usage on the plateform after 2015. The current usage metrics is available 48-96 hours after online publication and is updated daily on week days.
Initial download of the metrics may take a while.