Fig. 7
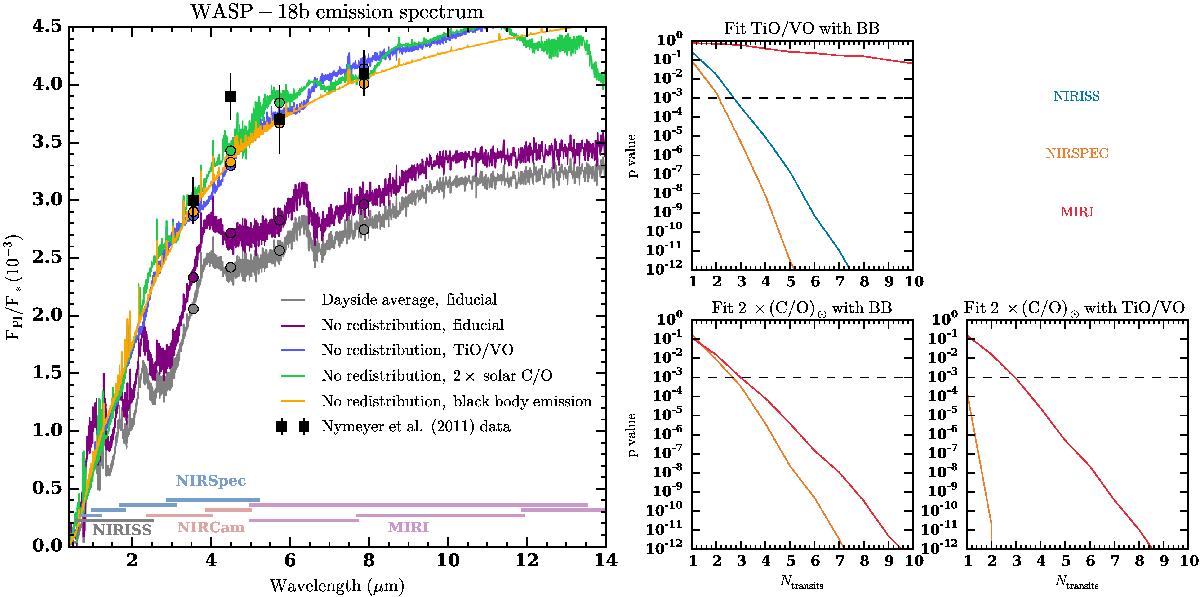
Left panel: synthetic spectra and observational data of the emission spectrum of WASP-18b. A description of the different lines is shown in the legend. The observational data by Nymeyer et al. (2011) are shown as black errorbars. The “emission” lines, which can be made out in the blackbody FPl/F∗ spectrum, are absorption lines of the stellar spectrum. The colored circles show the corresponding Spitzer channels for the synthetic spectra. Right panel: p values of the Kolmogorov-Smirnov test of the residuals between the synthetic observation of the three WASP-18b models and the two respective remaining models. The p value is shown as a function of Ntransit for data taken with the three different instruments listed in Table 3. In order to avoid distinguishing between the models based on offsets, the residual distributions were shifted to have a mean value of 0. The black dashed line denotes our threshold value of 10-3. If an instrument is not shown in one of the three sub-panels then it has a p value lower than 10-12 already after one observation.
Current usage metrics show cumulative count of Article Views (full-text article views including HTML views, PDF and ePub downloads, according to the available data) and Abstracts Views on Vision4Press platform.
Data correspond to usage on the plateform after 2015. The current usage metrics is available 48-96 hours after online publication and is updated daily on week days.
Initial download of the metrics may take a while.