Fig. 6
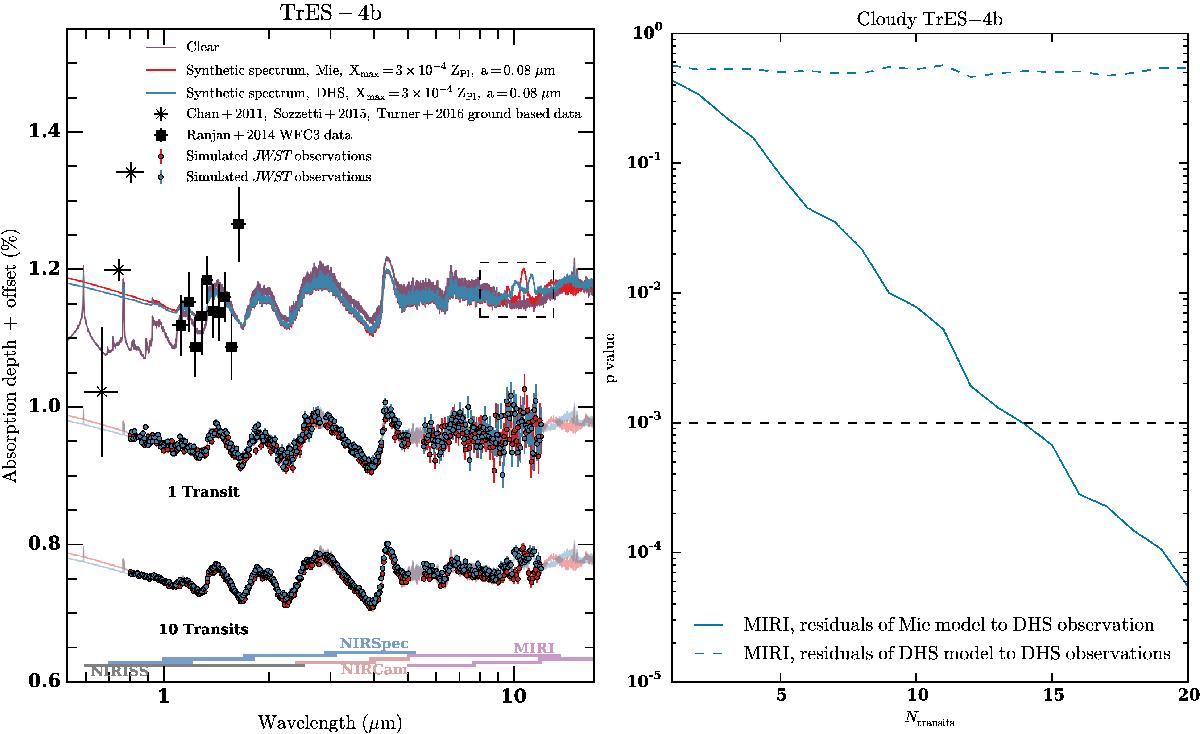
Left panel: synthetic transit spectra, observations, and synthetic observations for the planet TrES-4b. Black crosses denote the ground-based observational data by Chan et al. (2011), Sozzetti et al. (2015), Turner et al. (2016). Black squares denote the HST WFC3 data by Ranjan et al. (2014). Synthetic spectra for the homogeneously cloudy models with Xmax = 3 × 10⁻⁴ZPl are shown as teal and red solid lines for the DHS and Mie opacity, respectively. The dashed box at ~10 μm highlights the silicates features due to Mg2SiO4 resonances.The teal and red dots show the corresponding synthetic observations derived for one and ten transits, re-binned to a resolution of 50. Vertical offsets have been applied for the sake of clarity. Right panel: p values of the Kolmogorov-Smirnov test of the residuals between the synthetic observation of the TrES-4b DHS model and the Mie model (solid teal line). The p value is shown as a function of Ntransit for data taken with MIRI LRS considering only the wavelength range of the silicate feature (9–13 μm) and correcting for global model offsets. The dashed teal line shows the p value obtained when analyzing the residuals of the DHS model to its own observation. The black dashed line denotes our threshold value of 10-3.
Current usage metrics show cumulative count of Article Views (full-text article views including HTML views, PDF and ePub downloads, according to the available data) and Abstracts Views on Vision4Press platform.
Data correspond to usage on the plateform after 2015. The current usage metrics is available 48-96 hours after online publication and is updated daily on week days.
Initial download of the metrics may take a while.