Fig. 5
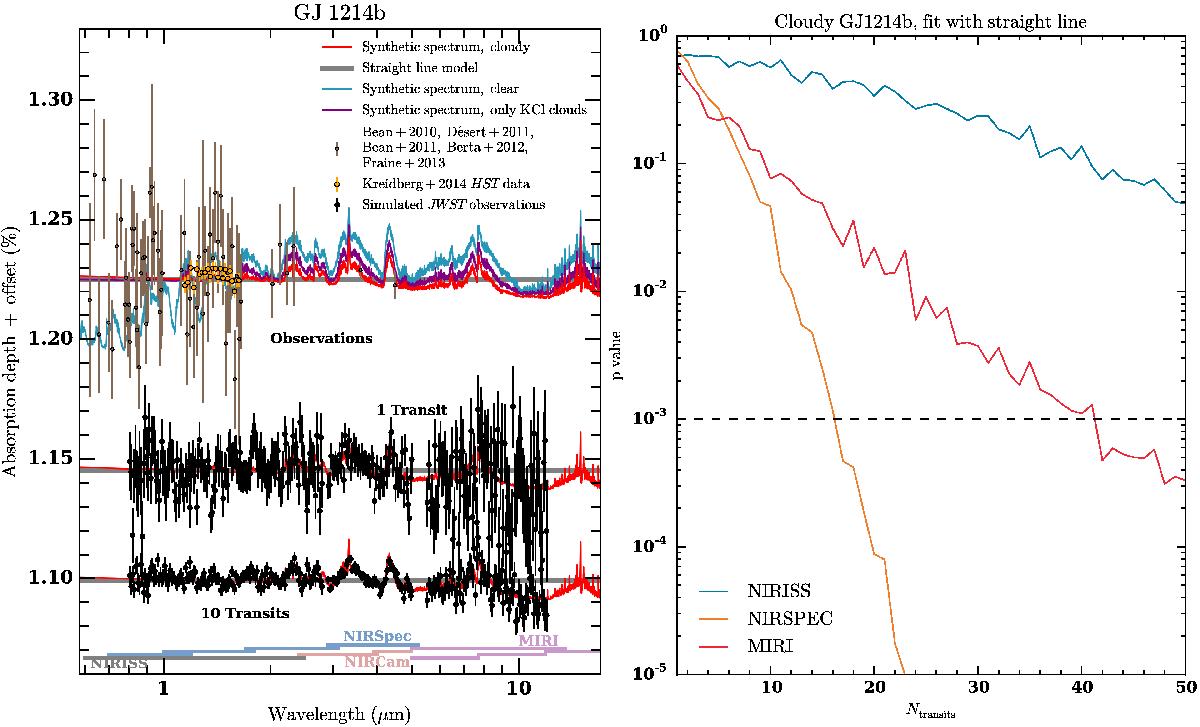
Left panel: synthetic transit spectra, observations, and synthetic observations for the planet GJ 1214b. The orange points denote the observational data by Kreidberg et al. (2014), while brown points denote the observational data by Bean et al. (2010), Désert et al. (2011), Bean et al. (2011), Berta et al. (2012), Fraine et al. (2013). Synthetic spectra for the cloudy fsed = 0.3 model (Model 3 in Table 2) are shown as red or purple solid lines for the case including Na2S+KCl clouds or KCl clouds only. The clear model is shown as a teal line. A straight line model is shown as a thick gray solid line. The black dots show the synthetic observations derived for one (top) and ten (bottom) transits, re-binned to a resolution of 50. Vertical offsets have been applied for the sake of clarity. Right panel: p values of the Kolmogorov-Smirnov test for the residuals between the synthetic observation of the Na2S+KCl cloud model and the straight line model fitted to these observations. The p value is shown as a function of Ntransit for the three different instruments of Table 3. For every (instrument, Ntransit) setup, a new straight line model is fitted to the observations. The black dashed line denotes our threshold value of 10-3.
Current usage metrics show cumulative count of Article Views (full-text article views including HTML views, PDF and ePub downloads, according to the available data) and Abstracts Views on Vision4Press platform.
Data correspond to usage on the plateform after 2015. The current usage metrics is available 48-96 hours after online publication and is updated daily on week days.
Initial download of the metrics may take a while.