Fig. 1
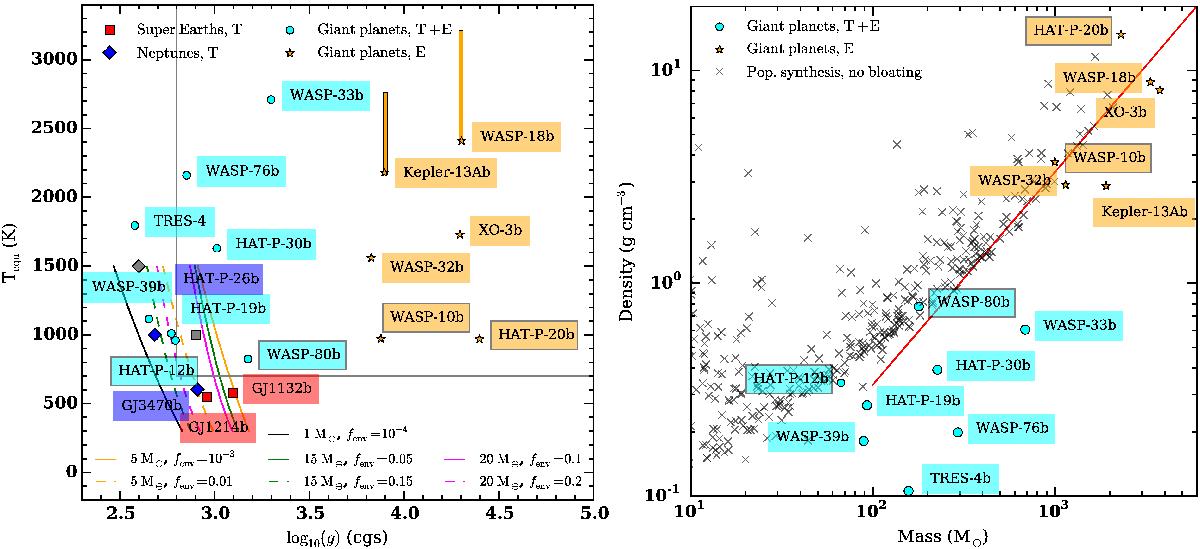
Left panel: our transit candidates in log (g)–Tequ space. See the legend for the meaning of the symbols. Candidates with gray symbols are artificial and have been introduced to fill in the parameter space. “T” and “E” in the legend stand for planets which can be observed in transmission or emission, respectively. The vertical and horizontal lines separate the mostly cloud-free (upper right region) from the potentially cloudy atmospheres (left and bottom regions) as defined in Stevenson (2016). The black, orange, green, and magenta lines show log (g)–Tequ curves of super-Earths and Neptune-like planets (Lopez & Fortney 2014) for the masses and envelope mass fractions as described in the legend. The giant planets which have a gray frame around their name box are not inflated. The upper ends of the vertical orange lines shown for Kepler-13Ab and WASP-18b denote the maximum brightness temperatures observed for these planets. Right panel: planetary mean density as a function of mass. Only the giant planet candidates are plotted here, in the same style as in the left panel. A sample of synthetic, non-inflated planets calculated using the model of Mordasini et al. (2012), Alibert et al. (2013), Jin et al. (2014) is shown as gray crosses. The value of the straight red line shown in the model is a linear function of the planetary mass, as is expected for non-inflated giant planets (see, e.g., Baruteau et al. 2016).
Current usage metrics show cumulative count of Article Views (full-text article views including HTML views, PDF and ePub downloads, according to the available data) and Abstracts Views on Vision4Press platform.
Data correspond to usage on the plateform after 2015. The current usage metrics is available 48-96 hours after online publication and is updated daily on week days.
Initial download of the metrics may take a while.