Free Access
Fig. 1
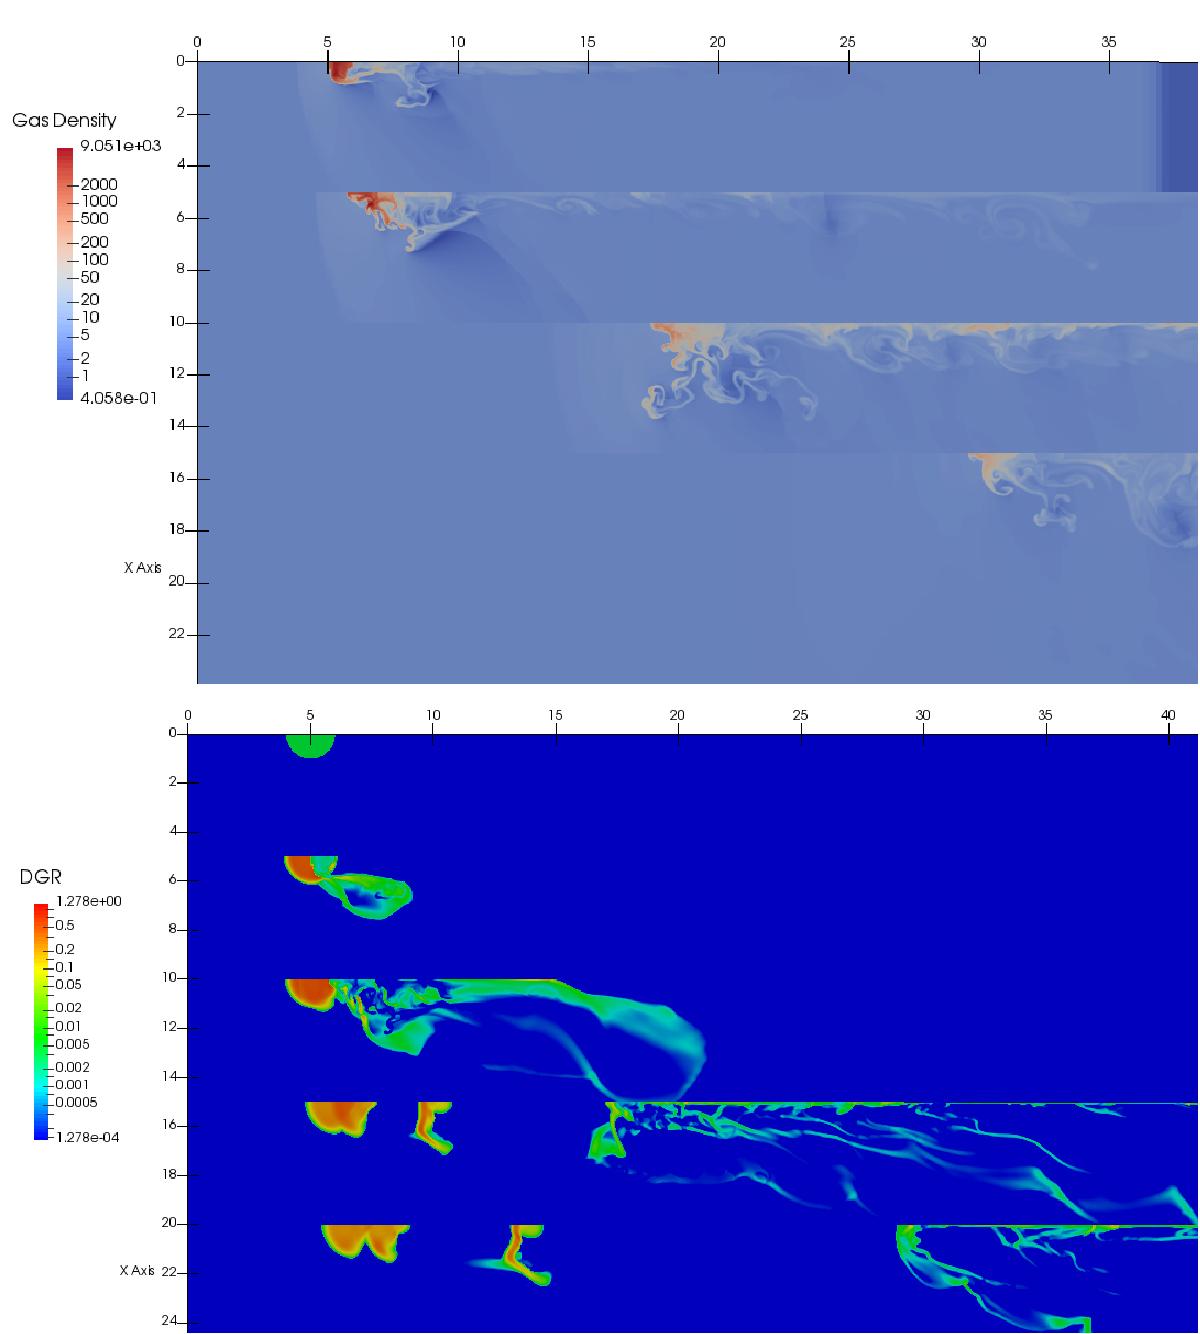
For case m10loD. Top: logarithm of gas density for times 100, 200, 540, and 700 kyr. These times correspond to a first, second, and third interaction peak, and the post-mixing phase. The symmetry axis is horizontal. Bottom: views on the dust-to-gas ratio (DGR) for the same times (and for our initial condition).
Current usage metrics show cumulative count of Article Views (full-text article views including HTML views, PDF and ePub downloads, according to the available data) and Abstracts Views on Vision4Press platform.
Data correspond to usage on the plateform after 2015. The current usage metrics is available 48-96 hours after online publication and is updated daily on week days.
Initial download of the metrics may take a while.