Fig. 3
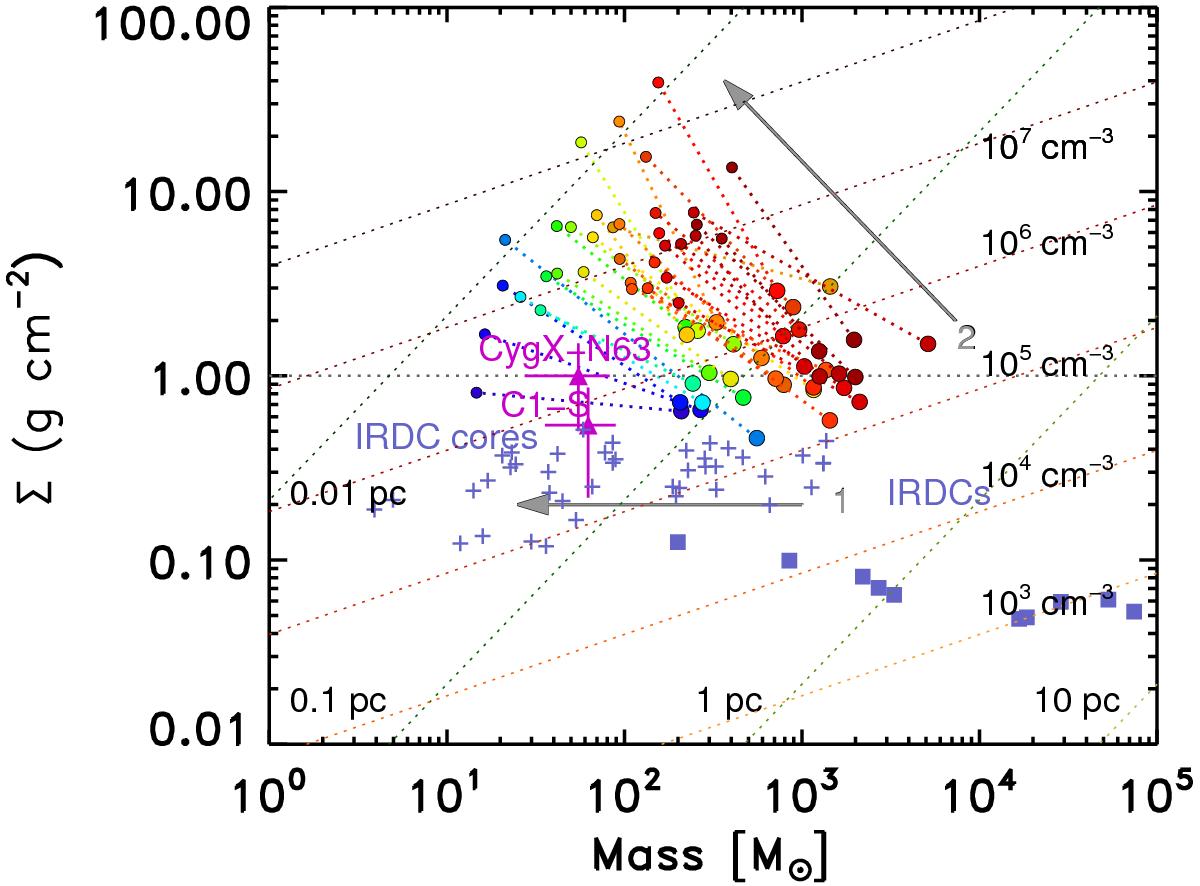
Surface density vs. mass diagram. Coloured dotted lines in different shades show constant radius (green) and nH number density (red; cf. Tan et al. 2014). Coloured large circles show clumps (ATLASGAL), while smaller circles show the cores (ALMA 7 m array), colours scaling from blue to red with increasing ![]() . We denote two massive cores with MMDC = 60 M⊙ (C1-S; Tan et al. 2013) and 55 M⊙ (CygX-N63; Bontemps et al. 2010). For comparison IRDC clumps (Kainulainen & Tan 2013) and cores are shown (Butler & Tan 2012). Grey arrows show two models: 1) a uniform clump density and 2) a single central object with an r-2 density profile.
. We denote two massive cores with MMDC = 60 M⊙ (C1-S; Tan et al. 2013) and 55 M⊙ (CygX-N63; Bontemps et al. 2010). For comparison IRDC clumps (Kainulainen & Tan 2013) and cores are shown (Butler & Tan 2012). Grey arrows show two models: 1) a uniform clump density and 2) a single central object with an r-2 density profile.
Current usage metrics show cumulative count of Article Views (full-text article views including HTML views, PDF and ePub downloads, according to the available data) and Abstracts Views on Vision4Press platform.
Data correspond to usage on the plateform after 2015. The current usage metrics is available 48-96 hours after online publication and is updated daily on week days.
Initial download of the metrics may take a while.