Fig. 2
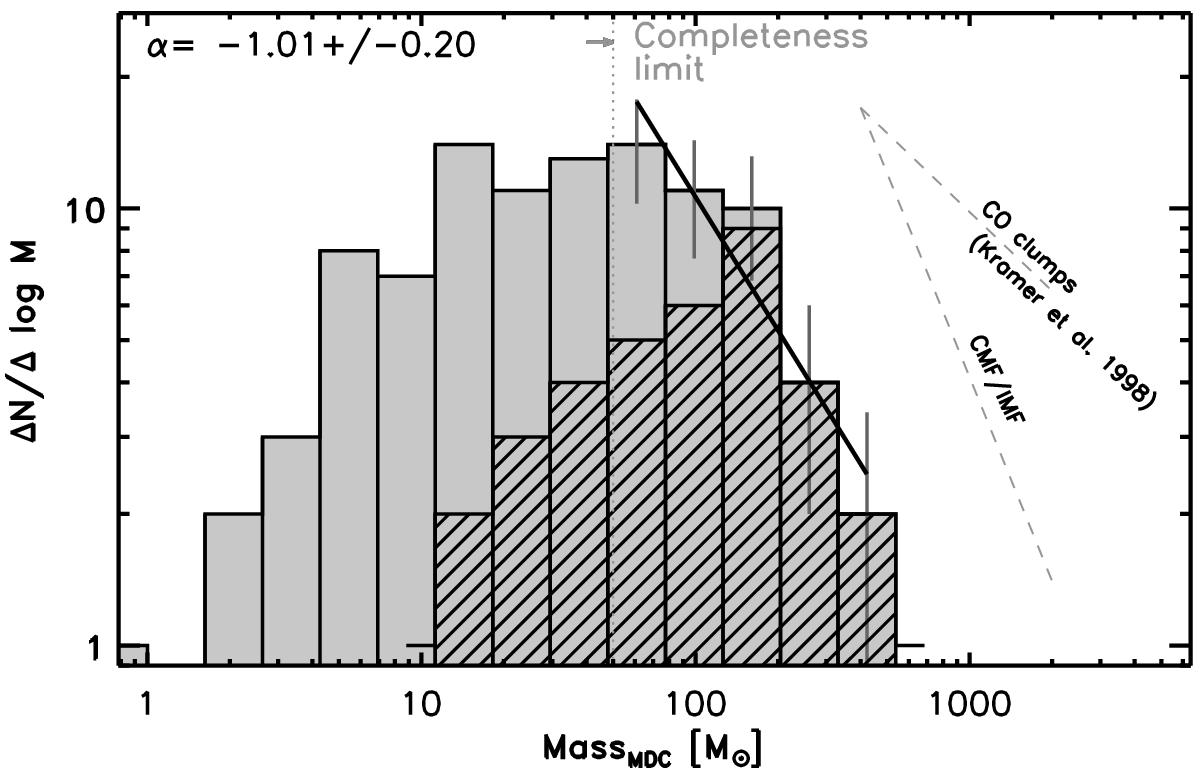
Mass distribution of MDCs within d ≤ 4.5 kpc. The Poisson error of each bin is shown as a grey line above the 10σrms completeness limit of 50 M⊙, the power-law fit is shown in a solid black line. Hashed area shows the distribution of the brightest cores (![]() ) per clump. Dashed lines show the slope of the CMF/IMF (André et al. 2014) and CO clumps (Kramer et al. 1998).
) per clump. Dashed lines show the slope of the CMF/IMF (André et al. 2014) and CO clumps (Kramer et al. 1998).
Current usage metrics show cumulative count of Article Views (full-text article views including HTML views, PDF and ePub downloads, according to the available data) and Abstracts Views on Vision4Press platform.
Data correspond to usage on the plateform after 2015. The current usage metrics is available 48-96 hours after online publication and is updated daily on week days.
Initial download of the metrics may take a while.