Free Access
Fig. 1
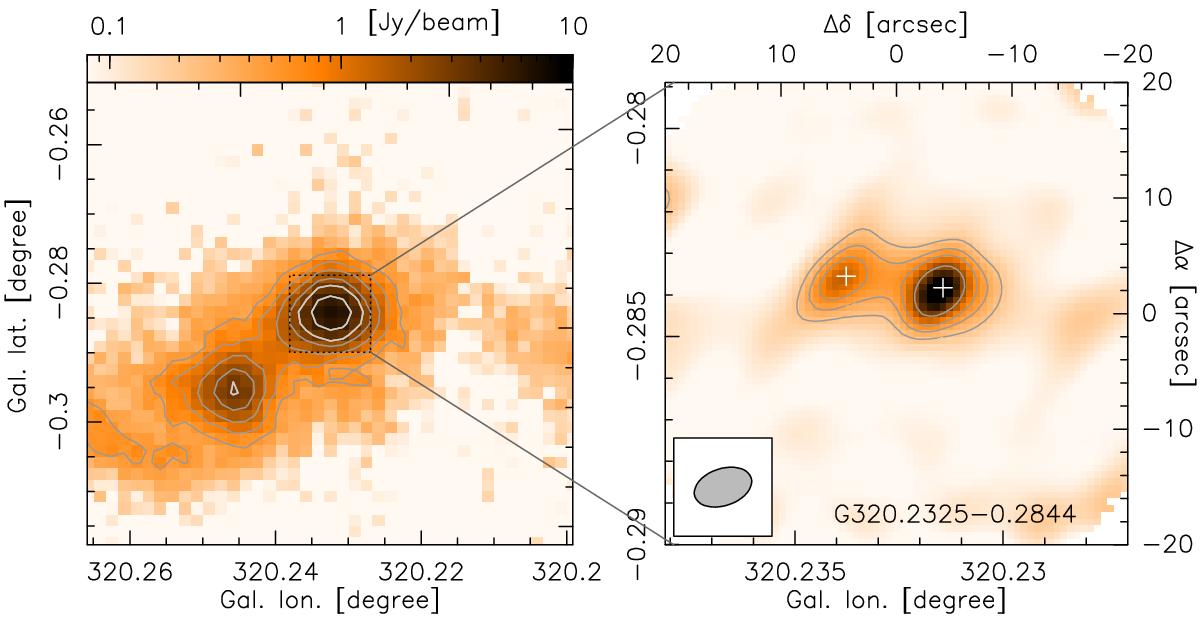
Left: Clump-scale view by ATLASGAL of an example source. Right: Line-free continuum emission at 345 GHz by the ALMA 7 m array. Contours start at 7σrms noise and increase in a logarithmic scale. White crosses indicate the extracted sources (see Table A.1). The synthesized beam is shown in the lower left corner.
Current usage metrics show cumulative count of Article Views (full-text article views including HTML views, PDF and ePub downloads, according to the available data) and Abstracts Views on Vision4Press platform.
Data correspond to usage on the plateform after 2015. The current usage metrics is available 48-96 hours after online publication and is updated daily on week days.
Initial download of the metrics may take a while.