Free Access
Fig. 5
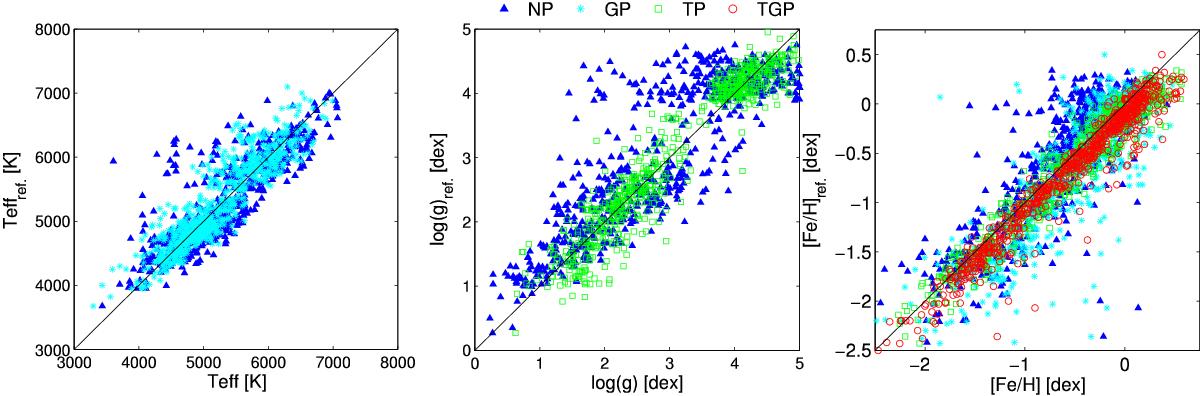
Comparison of the atmospheric parameters (from left to right: Teff, log (g) and [ Fe / H ] ) of the calibration set versus the values derived using the GAUFRE pipeline. Parameters were derived adopting four different strategies, following the same code as Fig. 7. Mean dispersions and offsets are displayed in Table 2.
Current usage metrics show cumulative count of Article Views (full-text article views including HTML views, PDF and ePub downloads, according to the available data) and Abstracts Views on Vision4Press platform.
Data correspond to usage on the plateform after 2015. The current usage metrics is available 48-96 hours after online publication and is updated daily on week days.
Initial download of the metrics may take a while.