Free Access
Fig. 3
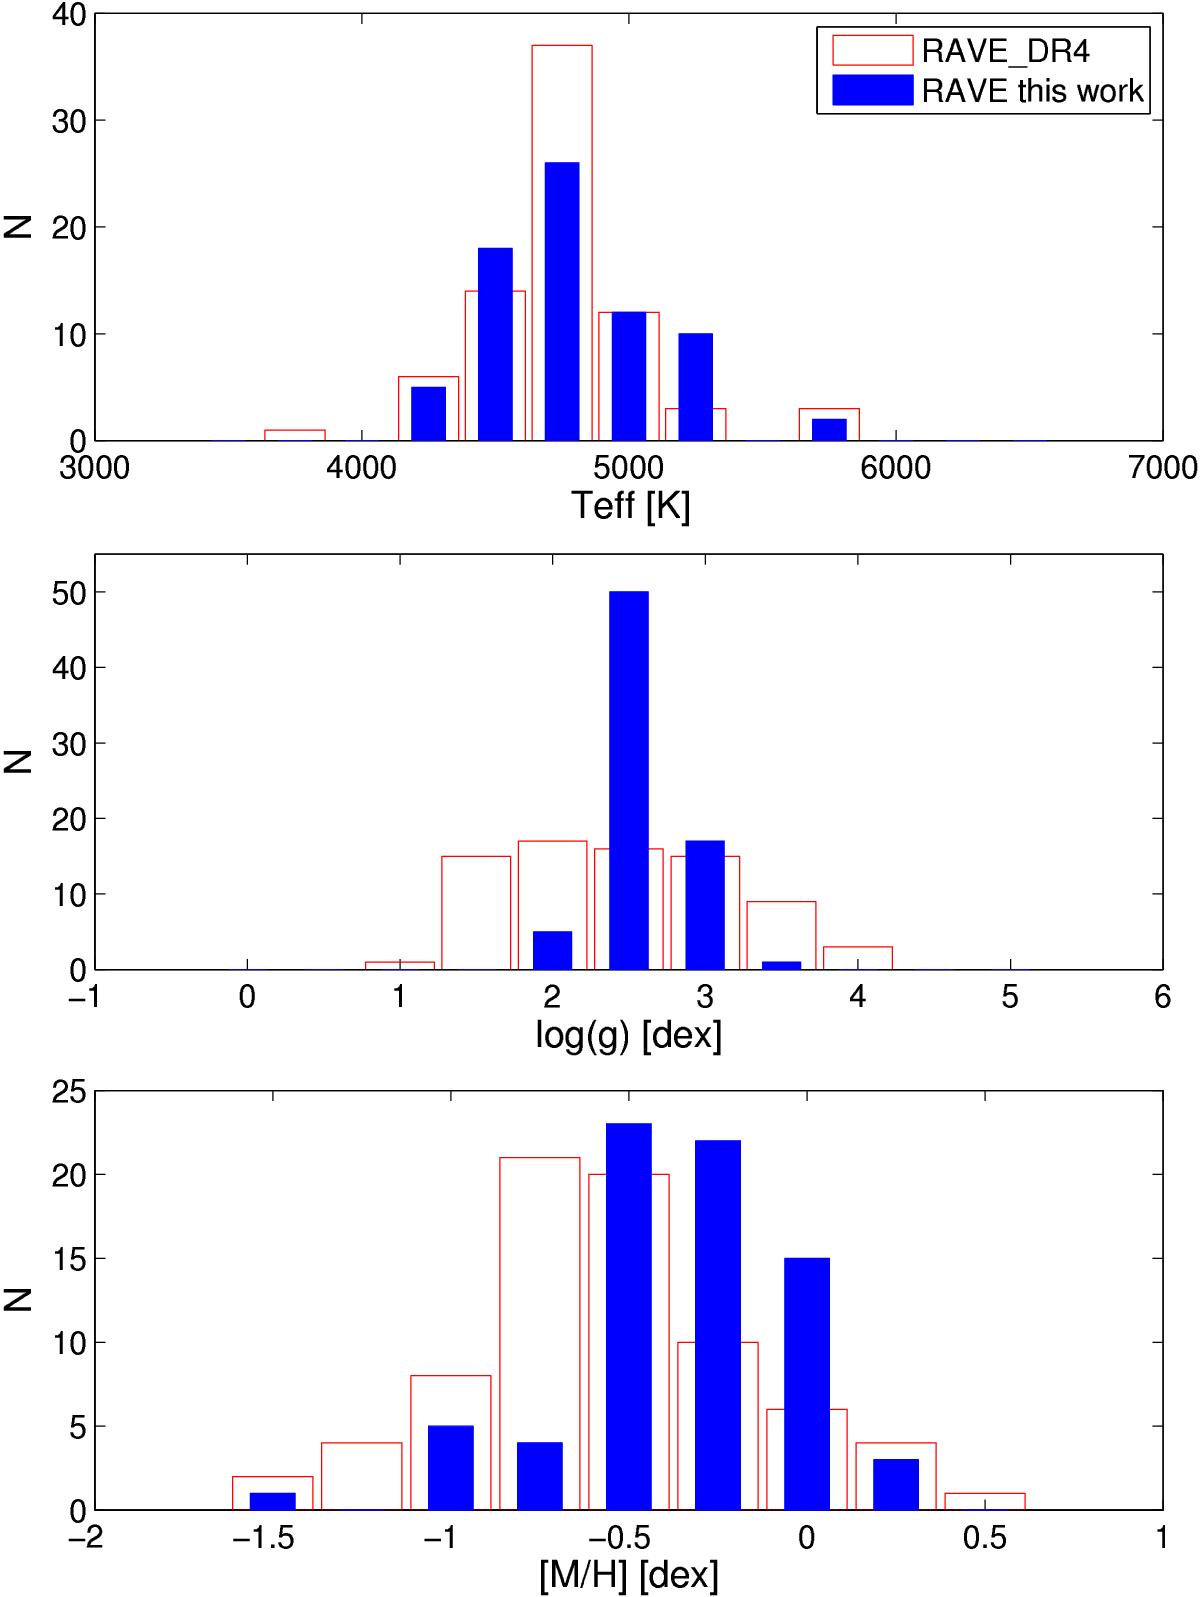
Distribution of Teff, log (g) and [M/H] of the RAVE stars analysed in this work. RAVE DR4 values are plotted in empty, red bars; the new atmospheric parameters derived using asteroseismology are plotted with blue, filled bars.
Current usage metrics show cumulative count of Article Views (full-text article views including HTML views, PDF and ePub downloads, according to the available data) and Abstracts Views on Vision4Press platform.
Data correspond to usage on the plateform after 2015. The current usage metrics is available 48-96 hours after online publication and is updated daily on week days.
Initial download of the metrics may take a while.