Fig. 14
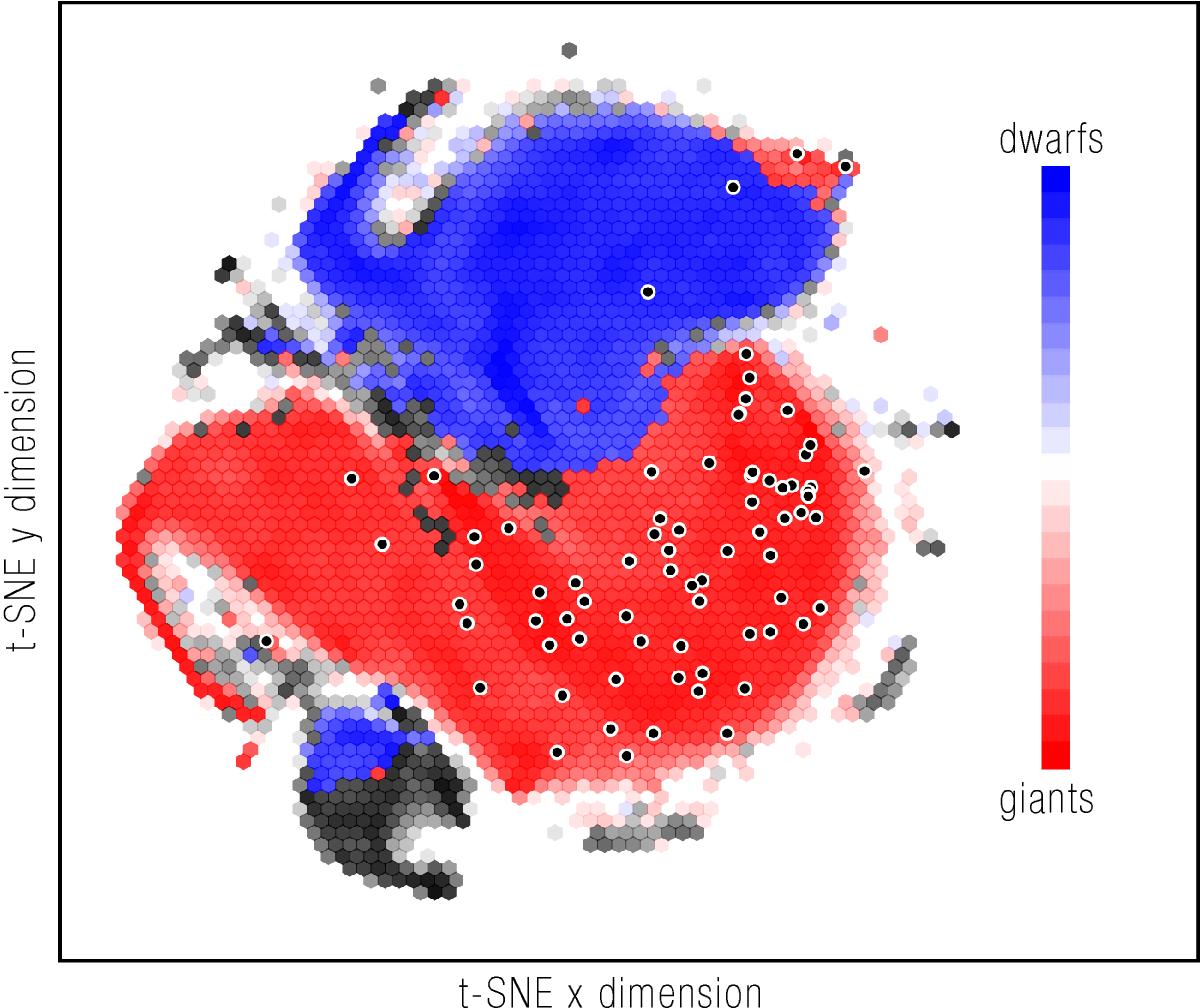
t-SNE projection of approximately 420 000 RAVE spectra. The scaling in both directions is arbitrary, therefore the units on the axes are omitted. The colour-scale corresponds to the gravity of the stars as computed by Kordopatis et al. (2013). Giants are shown in red and dwarfs in blue. Lighter shaded hexagons include fewer stars than darker ones. Over-plotted black dots indicate locations of the stars from this study.
Current usage metrics show cumulative count of Article Views (full-text article views including HTML views, PDF and ePub downloads, according to the available data) and Abstracts Views on Vision4Press platform.
Data correspond to usage on the plateform after 2015. The current usage metrics is available 48-96 hours after online publication and is updated daily on week days.
Initial download of the metrics may take a while.