Fig. 11
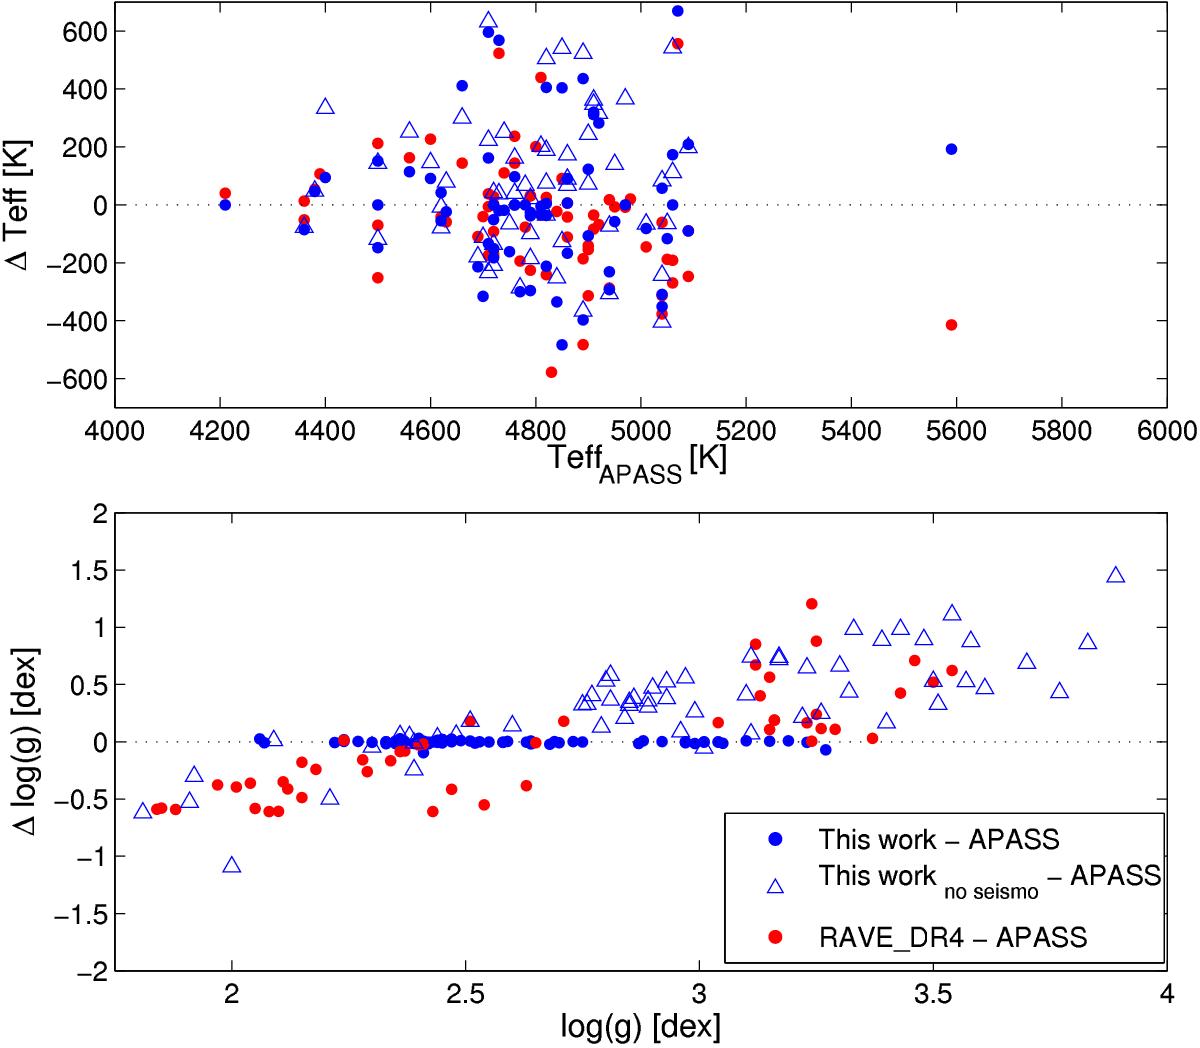
Top panel: comparison between the Teff derived in this work, with and without asteroseismology (blue points and blue triangles respectively) and in RAVE DR4 (red points) versus the one obtained using APASS photometry (Munari et al. 2014). Bottom panel: comparison between the log (g) derived in this work, with and without asteroseismology (blue points and blue triangles, respectively) and in RAVE DR4 (red points) versus the one obtained using APASS photometry (Munari et al. 2014).
Current usage metrics show cumulative count of Article Views (full-text article views including HTML views, PDF and ePub downloads, according to the available data) and Abstracts Views on Vision4Press platform.
Data correspond to usage on the plateform after 2015. The current usage metrics is available 48-96 hours after online publication and is updated daily on week days.
Initial download of the metrics may take a while.