Fig. A.2
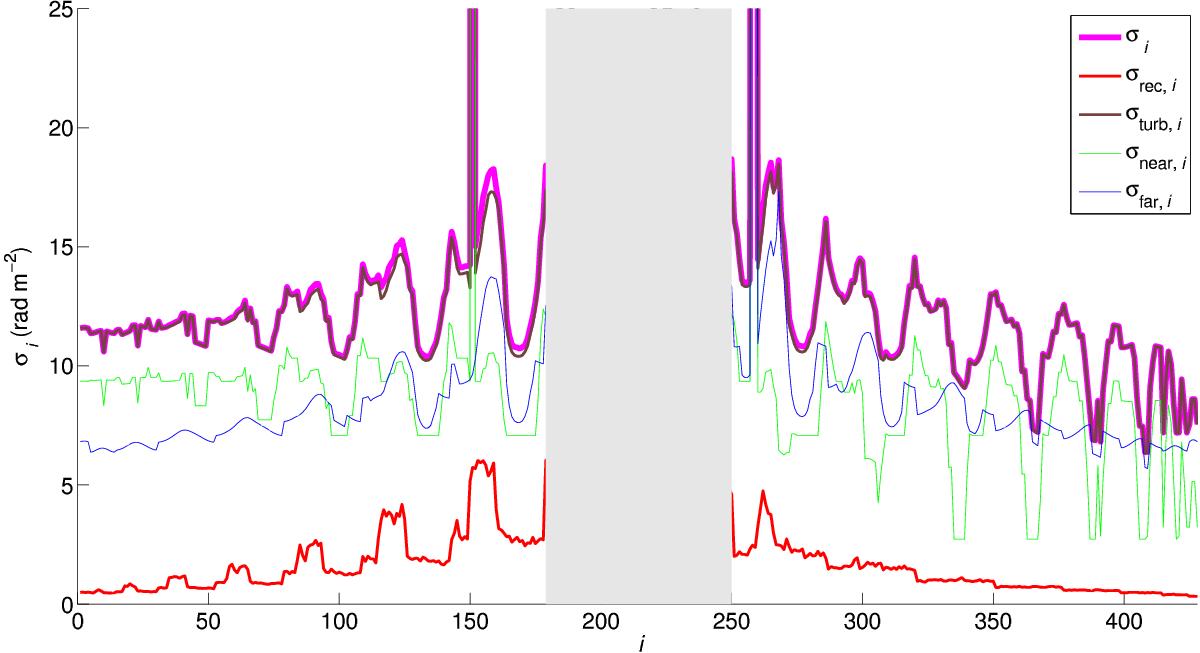
Total uncertainty in ![]() , σi, as a function of bin identifier, i (thick magenta line), for the 356 bins with latitude | b | ≥ 10°. Also plotted are the two contributions to σi (see Eq. (A.1)), which arise from the reconstruction of Oppermann et al. (2015) (σrec,i; red line) and from turbulence in the magneto-ionic ISM (σturb,i; brown line), respectively. The latter, in turn, is accompanied by its two contributions (see Eq. (A.6)), which arise from the N′ear nearest layers (thin green line) and from the Nlayer,i−N′ear more distant layers (thin blue line), respectively. Bins are ordered by bands of increasing latitude, from b = −90° to 90°, and in each latitude band, by increasing longitude, from ℓ = −180° to 180°. The vertical grey band in the middle corresponds to bins with latitude | b | < 10°, which are excluded from our study.
, σi, as a function of bin identifier, i (thick magenta line), for the 356 bins with latitude | b | ≥ 10°. Also plotted are the two contributions to σi (see Eq. (A.1)), which arise from the reconstruction of Oppermann et al. (2015) (σrec,i; red line) and from turbulence in the magneto-ionic ISM (σturb,i; brown line), respectively. The latter, in turn, is accompanied by its two contributions (see Eq. (A.6)), which arise from the N′ear nearest layers (thin green line) and from the Nlayer,i−N′ear more distant layers (thin blue line), respectively. Bins are ordered by bands of increasing latitude, from b = −90° to 90°, and in each latitude band, by increasing longitude, from ℓ = −180° to 180°. The vertical grey band in the middle corresponds to bins with latitude | b | < 10°, which are excluded from our study.
Current usage metrics show cumulative count of Article Views (full-text article views including HTML views, PDF and ePub downloads, according to the available data) and Abstracts Views on Vision4Press platform.
Data correspond to usage on the plateform after 2015. The current usage metrics is available 48-96 hours after online publication and is updated daily on week days.
Initial download of the metrics may take a while.