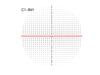
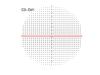
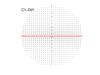
Fig. 6
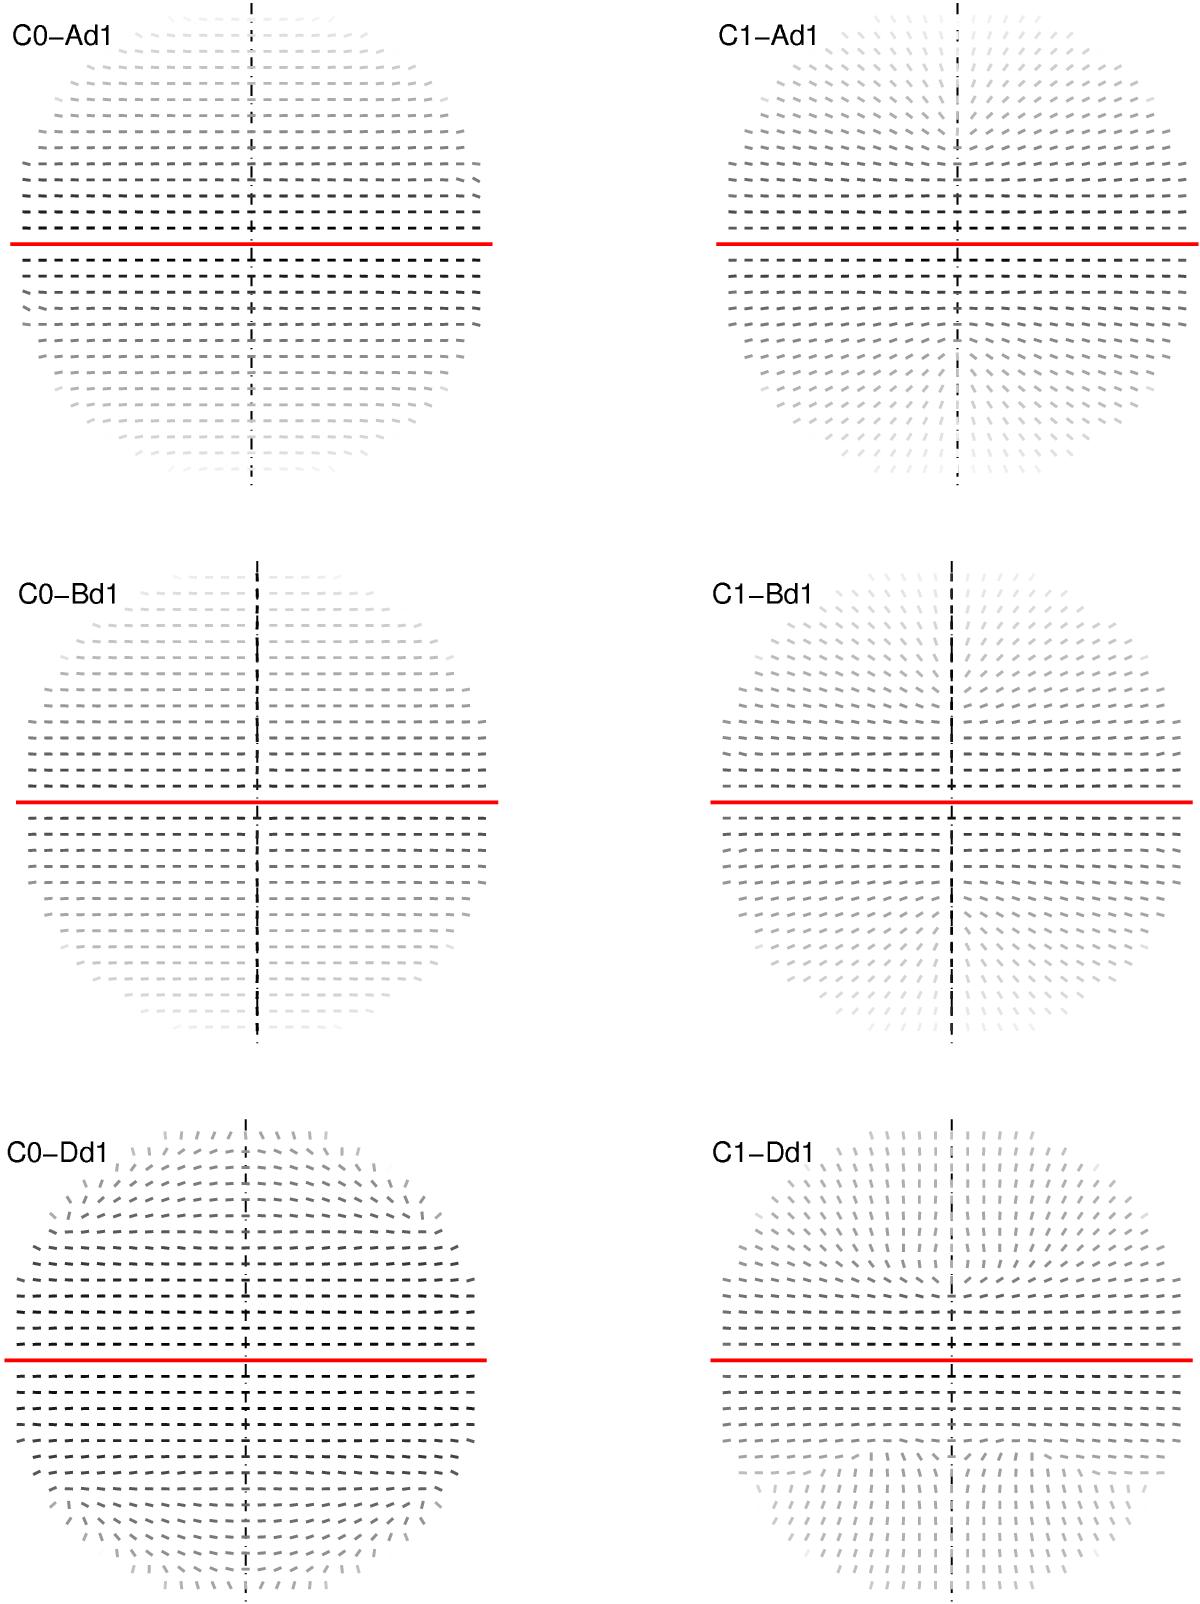
Synthetic maps of the magnetic orientation bars, inferred from the synchrotron polarized emission, of our Galaxy seen edge-on from the position (r → ∞,ϕ = 90°,z = 0), for the six best-fit magnetic field models listed in Table 2. The left and right columns are for a halo field described by model C0 (axisymmetric) and C1 (bisymmetric), respectively, while the top, middle, and bottom rows are for a disk field described by models Ad1, Bd1, and Dd1, respectively. Each map covers a circular area of radius 15 kpc, the trace of the Galactic plane is indicated by the horizontal, red, solid line, and the rotation axis by the vertical, black, dot-dashed line. All magnetic orientation bars have the same length, and their shade of grey scales logarithmically with the polarized intensity.
Current usage metrics show cumulative count of Article Views (full-text article views including HTML views, PDF and ePub downloads, according to the available data) and Abstracts Views on Vision4Press platform.
Data correspond to usage on the plateform after 2015. The current usage metrics is available 48-96 hours after online publication and is updated daily on week days.
Initial download of the metrics may take a while.