Fig. 2
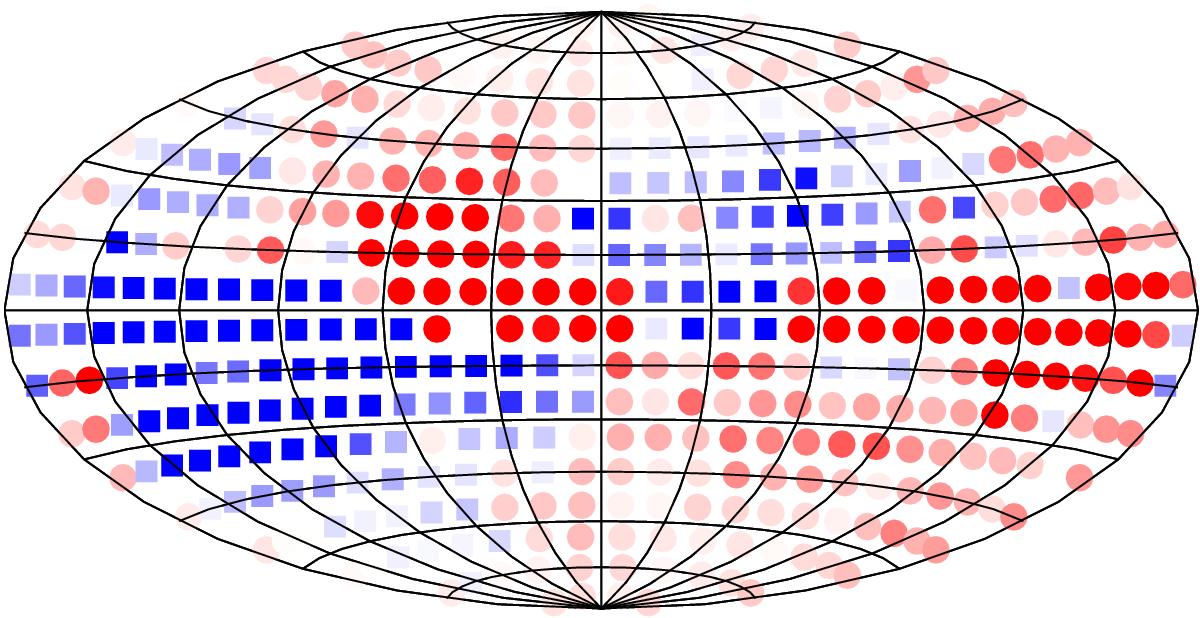
All-sky map, in Aitoff projection, showing the disposition of the 428 bins covering the celestial sphere, together with their average observational Galactic Faraday depth, before subtraction of the contribution from Wolleben et al.’s (2010) magnetized bubble. Positive [negative] values are plotted with red circles [blue squares], following the same color intensity scale as in Fig. 1. The coordinate system is also the same as in Fig. 1.
Current usage metrics show cumulative count of Article Views (full-text article views including HTML views, PDF and ePub downloads, according to the available data) and Abstracts Views on Vision4Press platform.
Data correspond to usage on the plateform after 2015. The current usage metrics is available 48-96 hours after online publication and is updated daily on week days.
Initial download of the metrics may take a while.