Fig. 1
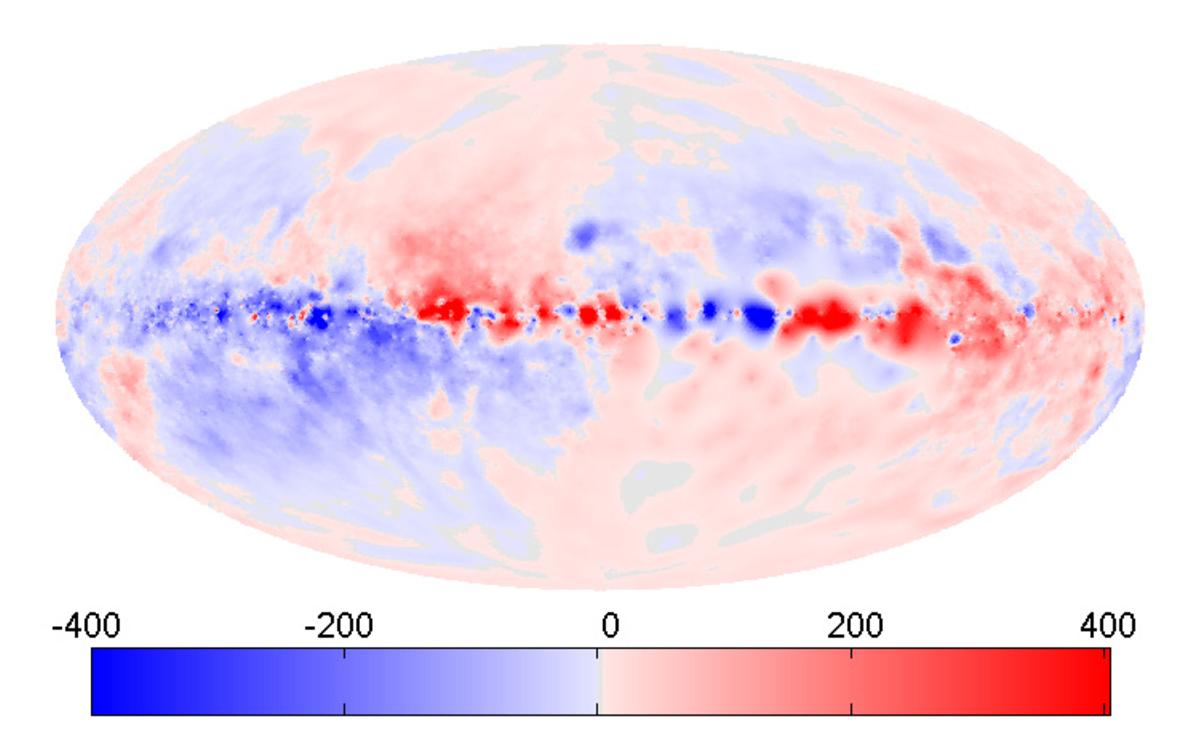
All-sky map, in Aitoff projection, of the observational Galactic Faraday depth, FDobs, as reconstructed by Oppermann et al. (2015). The map is in Galactic coordinates (ℓ,b), centered on the Galactic center (ℓ = 0°,b = 0°), and with longitude ℓ increasing to the left and latitude b increasing upward. Red [blue] regions have positive [negative] FDobs, corresponding to a magnetic field pointing on average toward [away from] the observer. The color intensity scales linearly with the absolute value of FDobs up to | FDobs | = 400 rad m-2 and saturates beyond this value.
Current usage metrics show cumulative count of Article Views (full-text article views including HTML views, PDF and ePub downloads, according to the available data) and Abstracts Views on Vision4Press platform.
Data correspond to usage on the plateform after 2015. The current usage metrics is available 48-96 hours after online publication and is updated daily on week days.
Initial download of the metrics may take a while.