Fig. 2
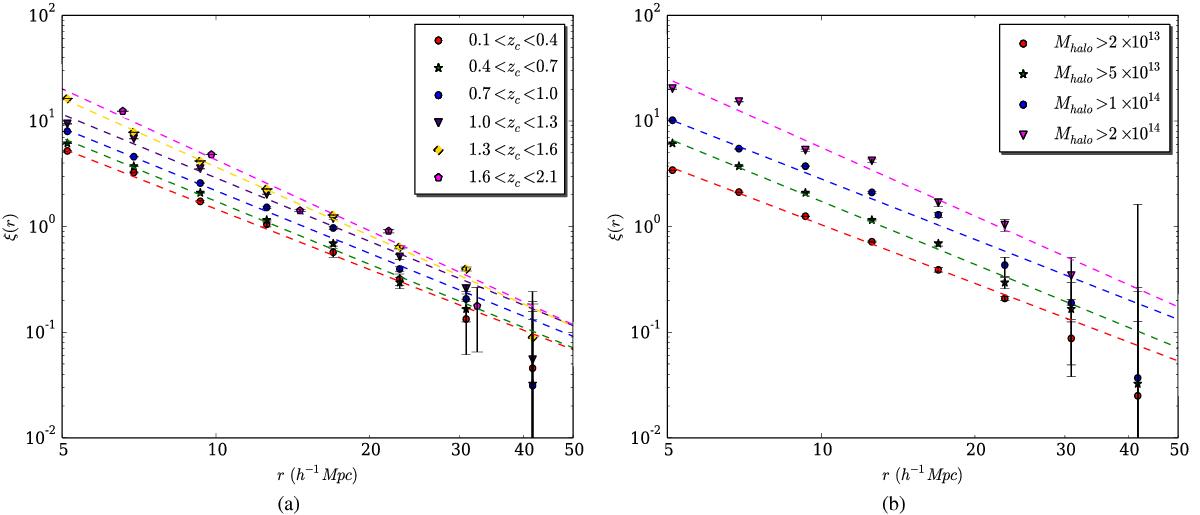
Left panel: Correlation functions for clusters with Mhalo > 5 × 10¹³h-1M⊙ in six different redshift slices. The dashed lines show the corresponding power-law best-fits. The parameter values for the fits can be found in Table 1. Right panel: Correlation functions in the redshift slice 0.4 < zc < 0.7 for four different mass cuts (with units h-1M⊙). The dashed lines show the corresponding power-law best-fits. The parameter values for the fits can be found in Table 1. Error bars are the square root of the diagonal values of the covariance matrix calculated from the jackknife resampling method.
Current usage metrics show cumulative count of Article Views (full-text article views including HTML views, PDF and ePub downloads, according to the available data) and Abstracts Views on Vision4Press platform.
Data correspond to usage on the plateform after 2015. The current usage metrics is available 48-96 hours after online publication and is updated daily on week days.
Initial download of the metrics may take a while.