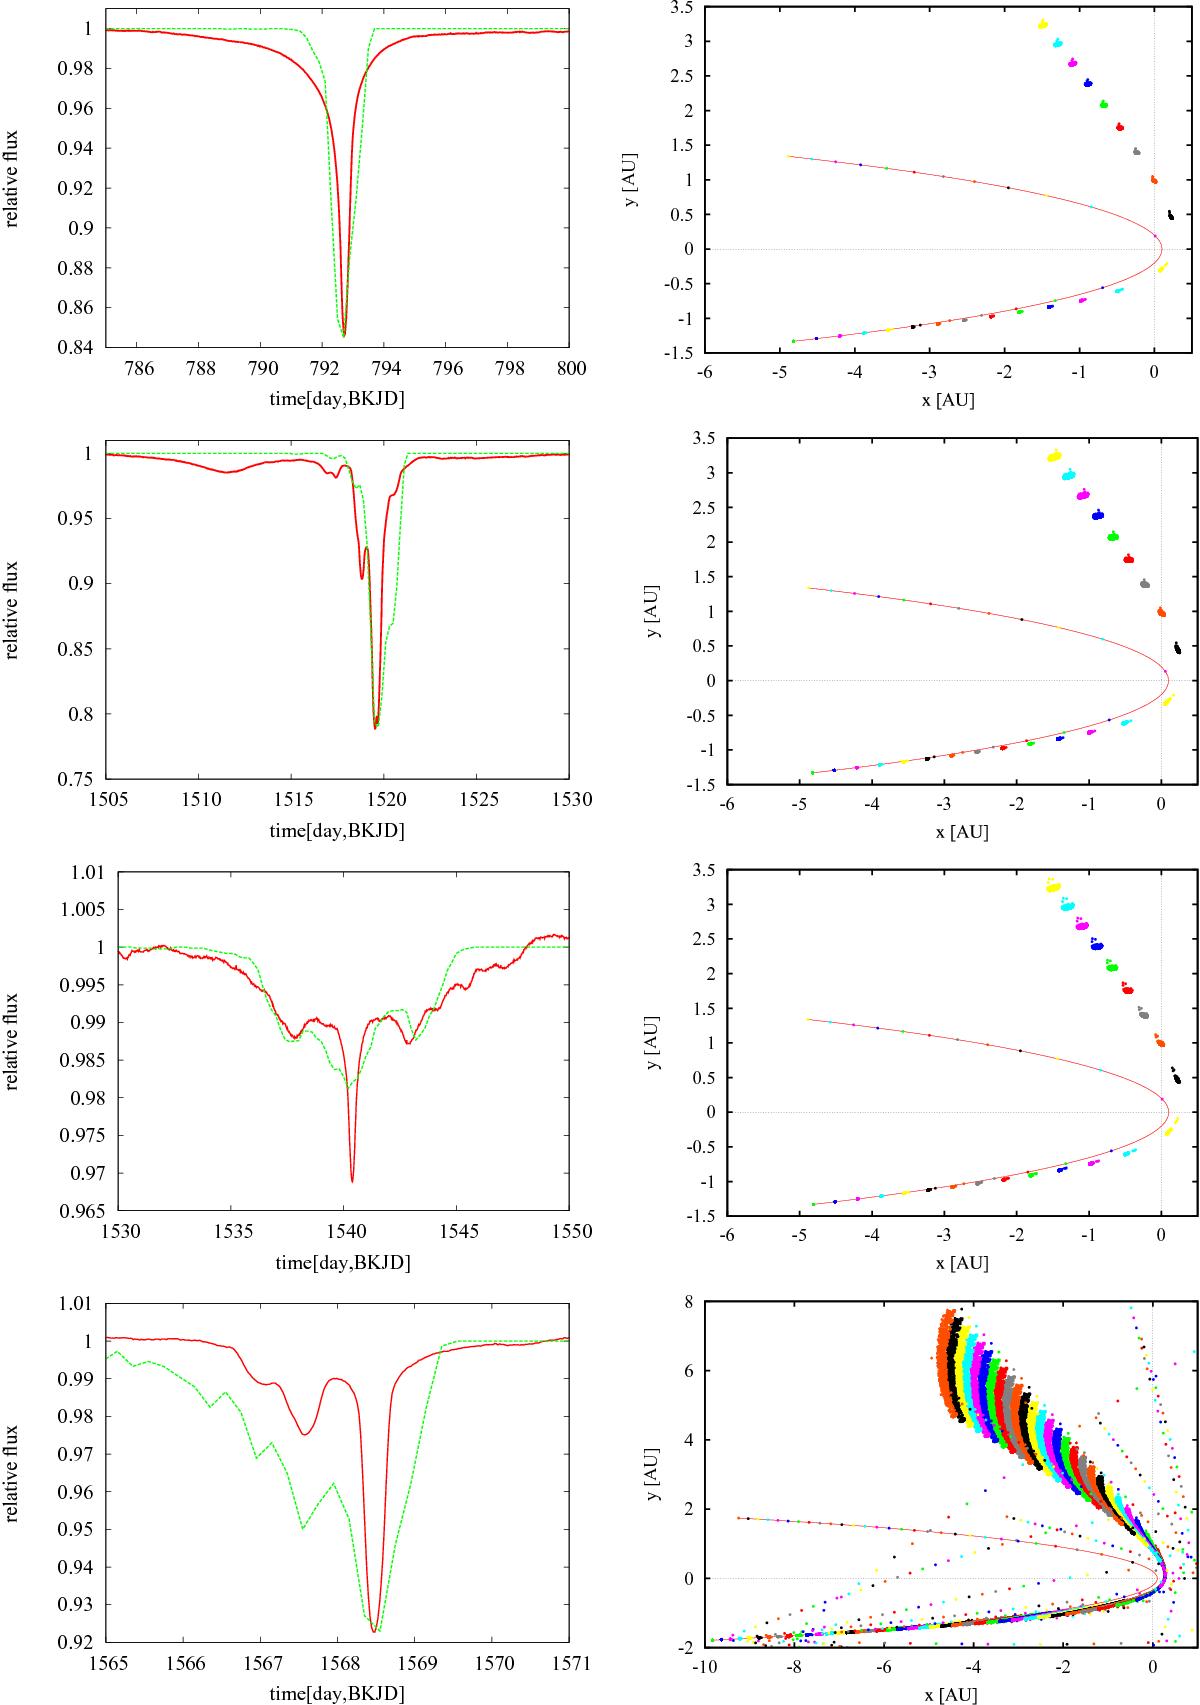
Fig. 5

Comparison of observations with model (A). Each row corresponds to one of the 800-, 1520-, 1540-, and 1570-day features. Left column: the observations (red/solid line) and model (A) (green/dashed). The fits may not be perfect but the main morphological features are represented. Right column: the cloud of particles (dots) and its parent body (solid line) orbiting the star. Different colors are used to plot particles at different times separated by 25-day intervals. A small number of particles may suffer from close encounters and were thrown into chaotic orbits.
Current usage metrics show cumulative count of Article Views (full-text article views including HTML views, PDF and ePub downloads, according to the available data) and Abstracts Views on Vision4Press platform.
Data correspond to usage on the plateform after 2015. The current usage metrics is available 48-96 hours after online publication and is updated daily on week days.
Initial download of the metrics may take a while.


