Fig. 6
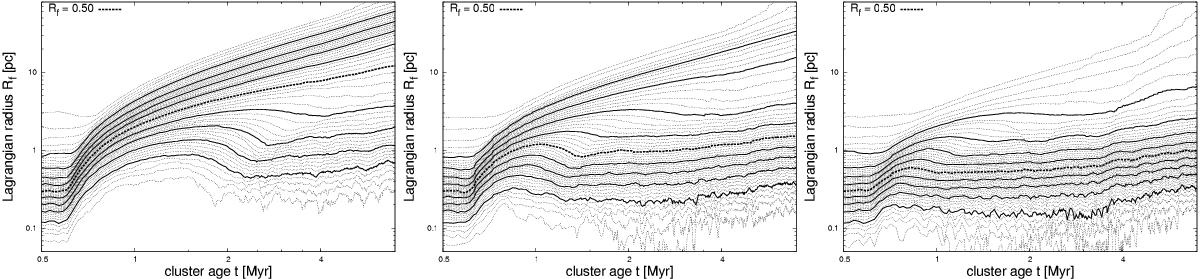
Evolution over 7 Myr for 104M⊙ clusters with an initial HMR of 0.3 pc for εSFE = 0.33 (left panel), εSFE = 0.50 (middle panel) and εSFE = 0.66 (right panel). Pictured are 50 Lagrange radii, reaching from 2% to 99% in 2% intervals. As a visual aid, the prominent dashed curve refers to the HMR, the other prominent curves mark 10% steps.
Current usage metrics show cumulative count of Article Views (full-text article views including HTML views, PDF and ePub downloads, according to the available data) and Abstracts Views on Vision4Press platform.
Data correspond to usage on the plateform after 2015. The current usage metrics is available 48-96 hours after online publication and is updated daily on week days.
Initial download of the metrics may take a while.