Fig. 8
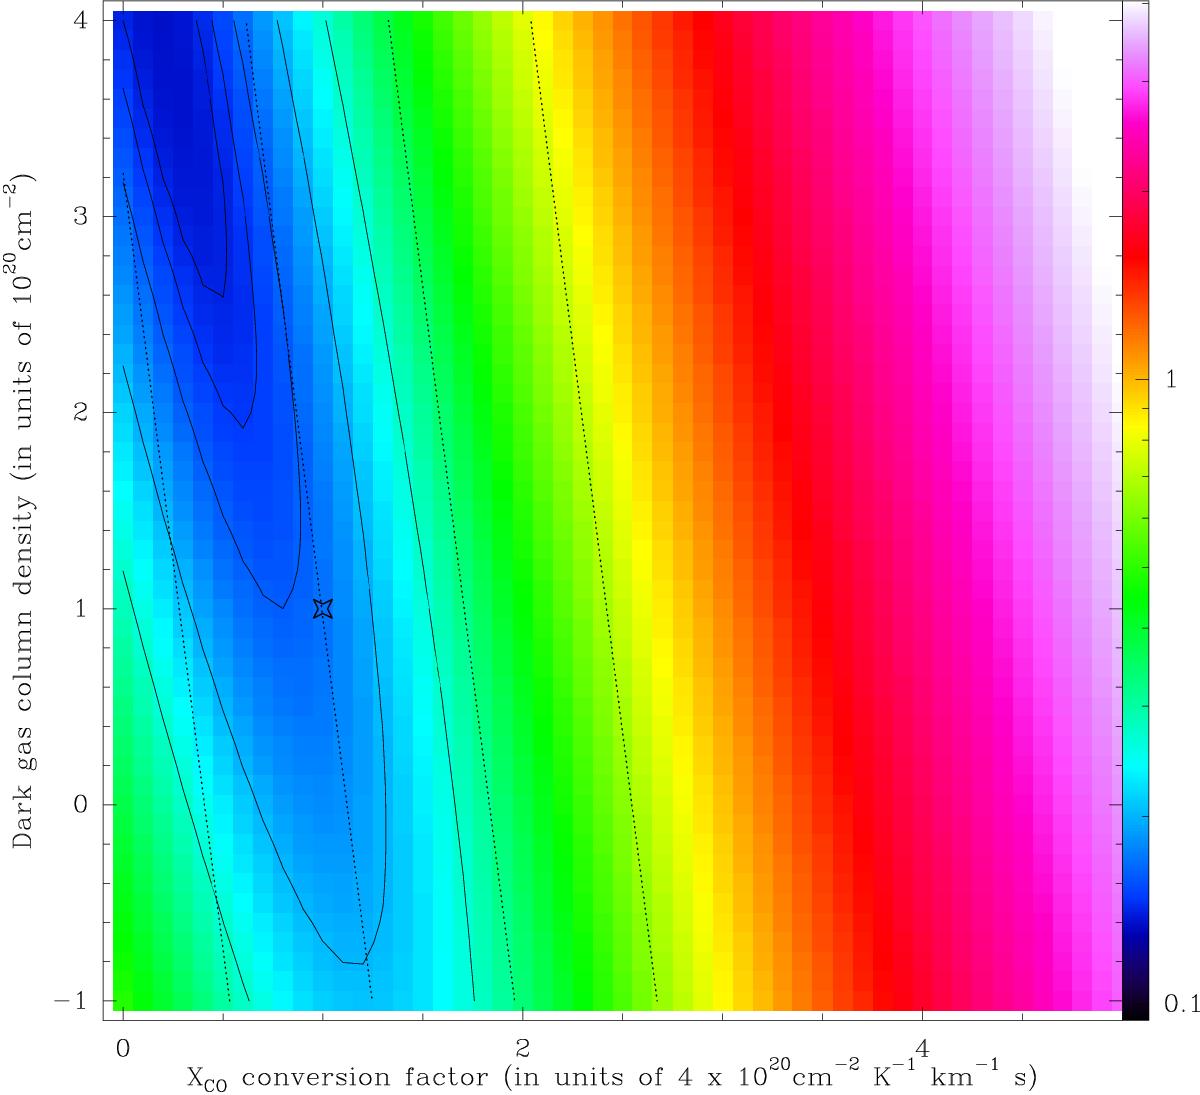
Quality of fit for model with ICO = 1 ± 0.25 K km s-1, N(H i) = 8 ± 1 × 1020 cm-2, and Kdark = 1 ± 0.25 × 1020 cm-2, assuming that the uncertainty in the dust surface density is 25%. Dotted lines represent, from left to right, constant GDR values of 100, 150, 200, 250. The star at XCO = 4 × 1020 cm-2/ (K km s-1) is the input value but the best fit is far from that.
Current usage metrics show cumulative count of Article Views (full-text article views including HTML views, PDF and ePub downloads, according to the available data) and Abstracts Views on Vision4Press platform.
Data correspond to usage on the plateform after 2015. The current usage metrics is available 48-96 hours after online publication and is updated daily on week days.
Initial download of the metrics may take a while.