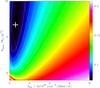
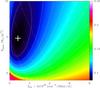
Fig. 3
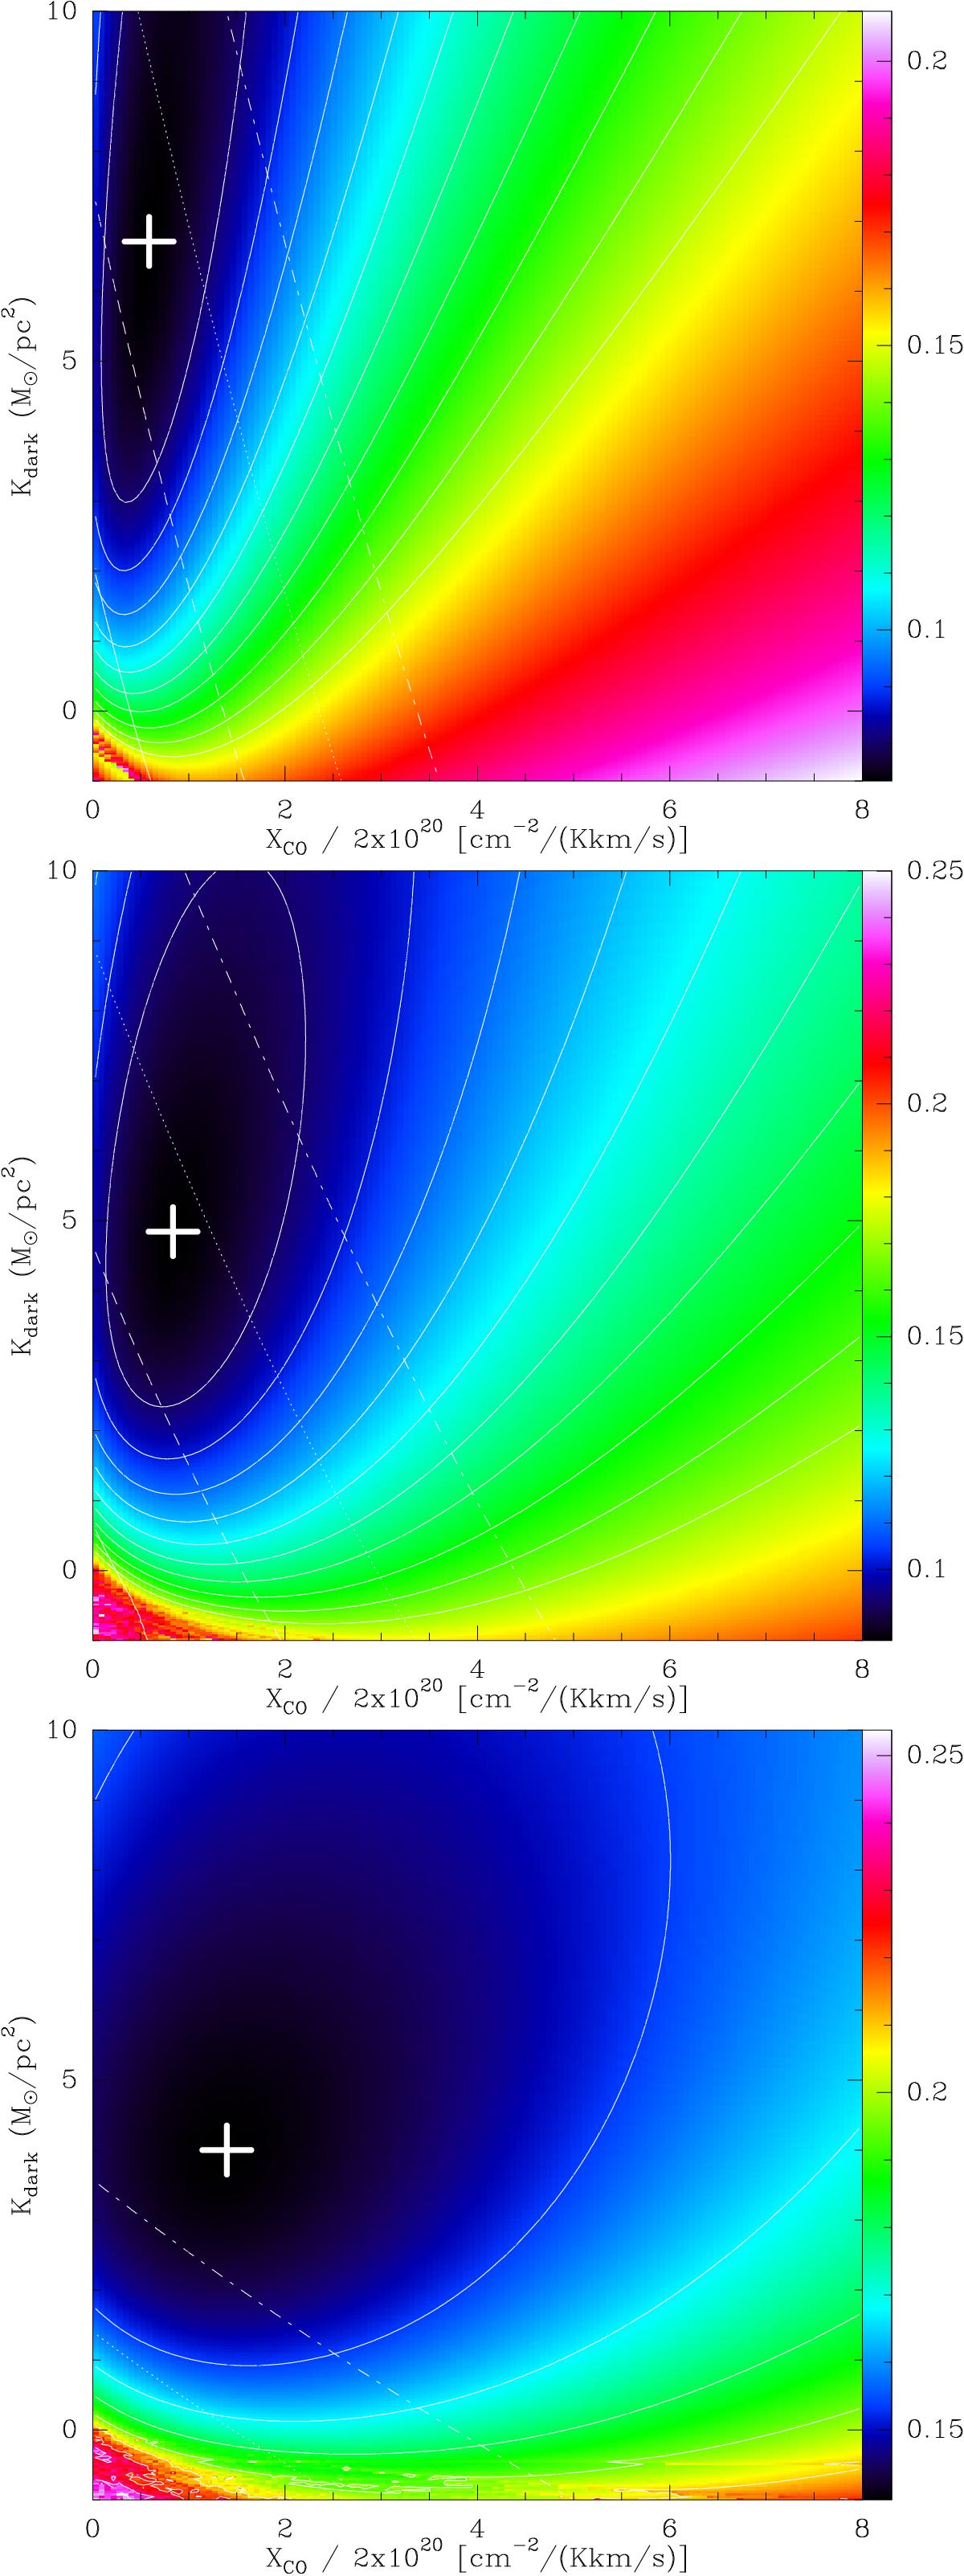
Scatter in log (GDR) as a function of XCO and Kdark. The color scale and solid white contours indicate the amplitude of the scatter in log (GDR) as measured by the standard deviation for varying XCO and Kdark offsets. Radii between 0 and 1 kpc (top), 1−2 kpc (middle), and 4−5 kpc (bottom). The white cross corresponds to the minimum scatter (i.e., best fit). The contours correspond to constant scatter values and give an indication of the uncertainties and degeneracies. The white lines correspond to constant GDR values of 100 (solid), 150 (dashed), 200 (dotted), 250 (dash-dotted).
Current usage metrics show cumulative count of Article Views (full-text article views including HTML views, PDF and ePub downloads, according to the available data) and Abstracts Views on Vision4Press platform.
Data correspond to usage on the plateform after 2015. The current usage metrics is available 48-96 hours after online publication and is updated daily on week days.
Initial download of the metrics may take a while.