Free Access
Fig. 22
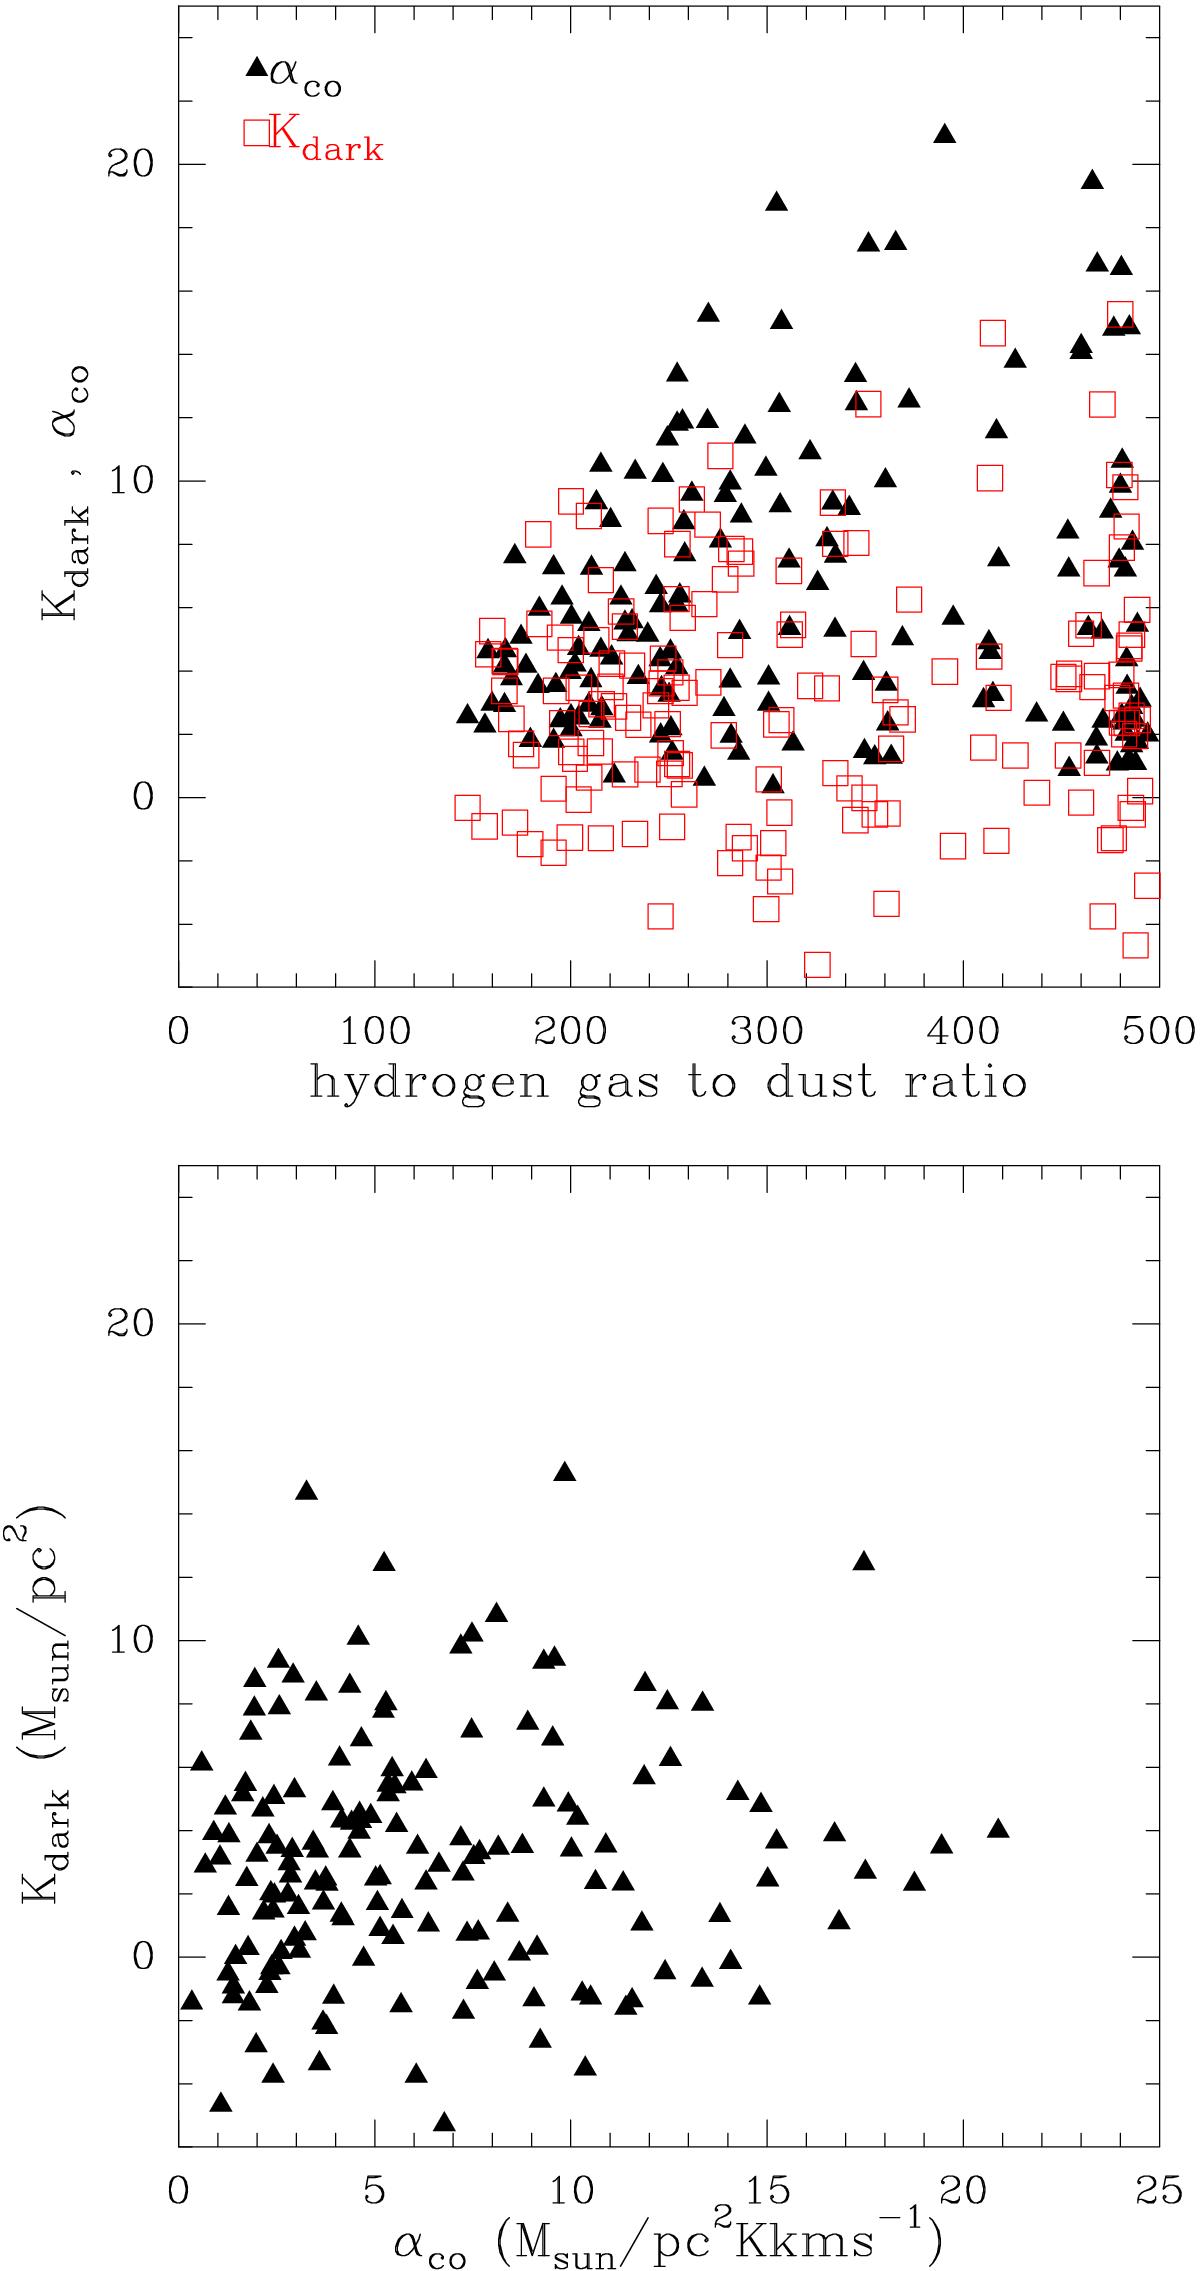
Search for degeneracies between the GDR, XCO, and Kdark in the Bayesian approach. Top panel: XCO (αCO) and Kdark as a function of GDR. Bottom panel: link (or absence) between XCO (αco) and Kdark. Each point represents a pixel in the maps shown in Fig. 16.
Current usage metrics show cumulative count of Article Views (full-text article views including HTML views, PDF and ePub downloads, according to the available data) and Abstracts Views on Vision4Press platform.
Data correspond to usage on the plateform after 2015. The current usage metrics is available 48-96 hours after online publication and is updated daily on week days.
Initial download of the metrics may take a while.