Free Access
Fig. 21
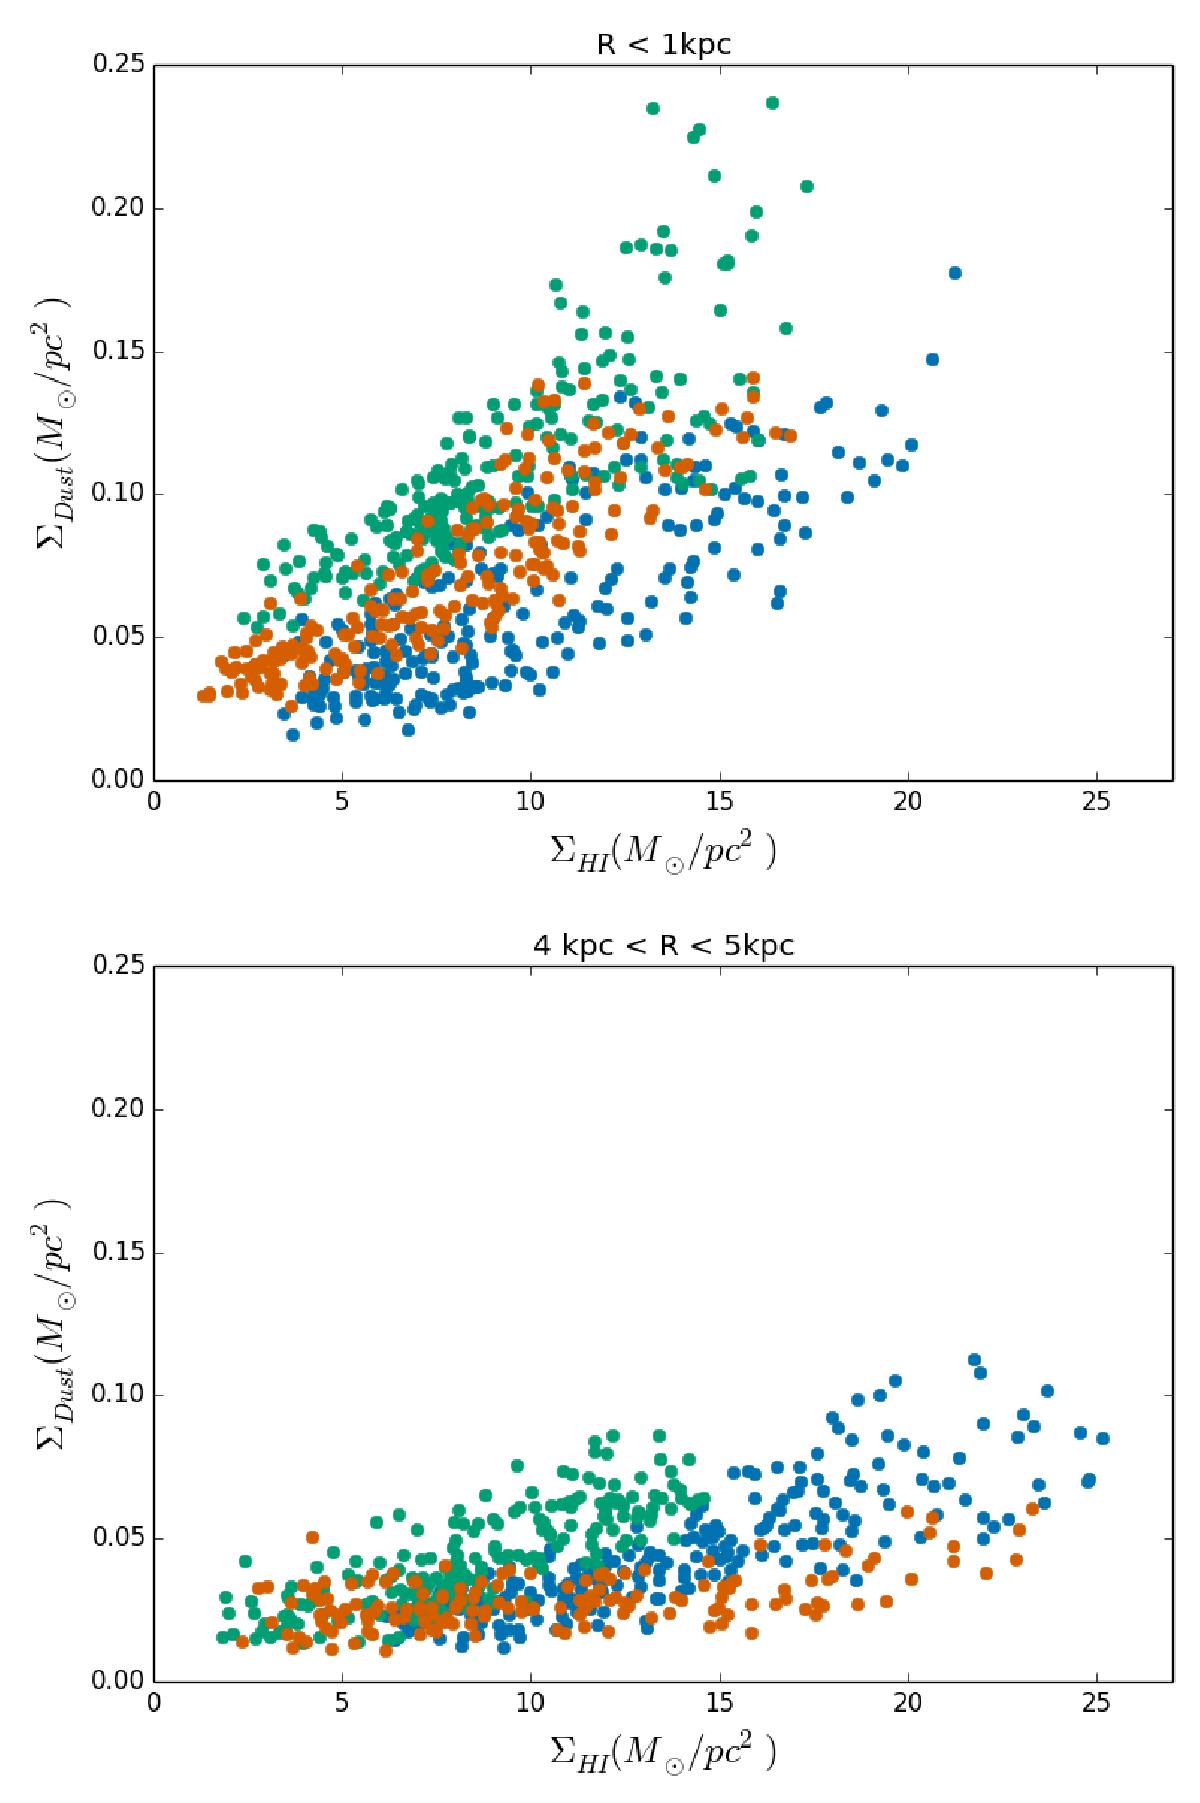
Top: link between H i column density and dust surface density for 3 macro-pixels near the center of M 33. Each color represents the pixel values of N(H i) and Σdust for a single macro-pixel. Bottom: same as above but for 3 macro-pixels between 4 and 5 kpc from the center.
Current usage metrics show cumulative count of Article Views (full-text article views including HTML views, PDF and ePub downloads, according to the available data) and Abstracts Views on Vision4Press platform.
Data correspond to usage on the plateform after 2015. The current usage metrics is available 48-96 hours after online publication and is updated daily on week days.
Initial download of the metrics may take a while.