Fig. 20
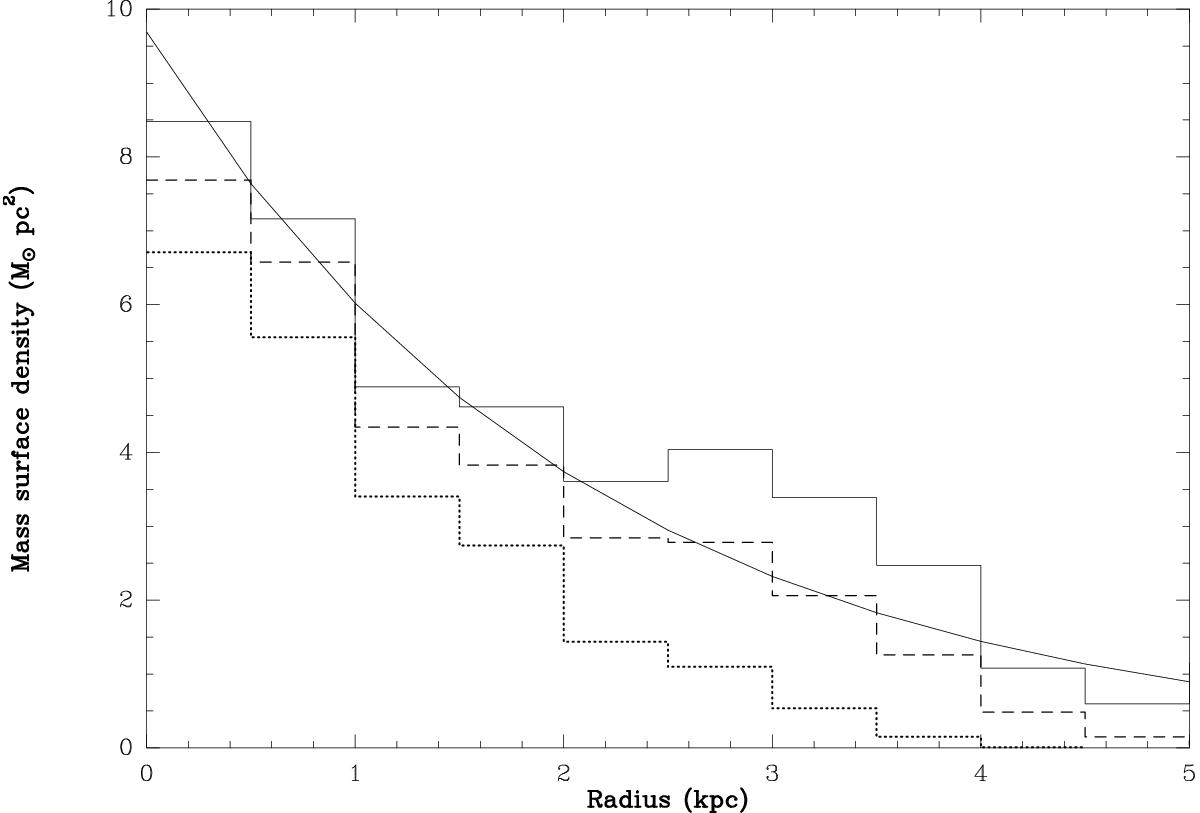
H2 surface density derived from CO and Kdark derived from the Bayesian analysis. The continuous curve shows ΣH2 based on Fig. 10 of Druard et al. (2014) corrected to a XCO factor of 1.1 Galactic and uncorrected for inclination and helium content. The histograms show the CO dark gas surface density. The solid histogram shows Kdark as derived assuming that all positions have the same dark column as the positions where CO is detected above the threshold. The dashed and dotted histograms represent Kdark assuming that the dark column only is present where CO is detected above the 0σ and 3σ thresholds respectively.
Current usage metrics show cumulative count of Article Views (full-text article views including HTML views, PDF and ePub downloads, according to the available data) and Abstracts Views on Vision4Press platform.
Data correspond to usage on the plateform after 2015. The current usage metrics is available 48-96 hours after online publication and is updated daily on week days.
Initial download of the metrics may take a while.