Free Access
Fig. 17
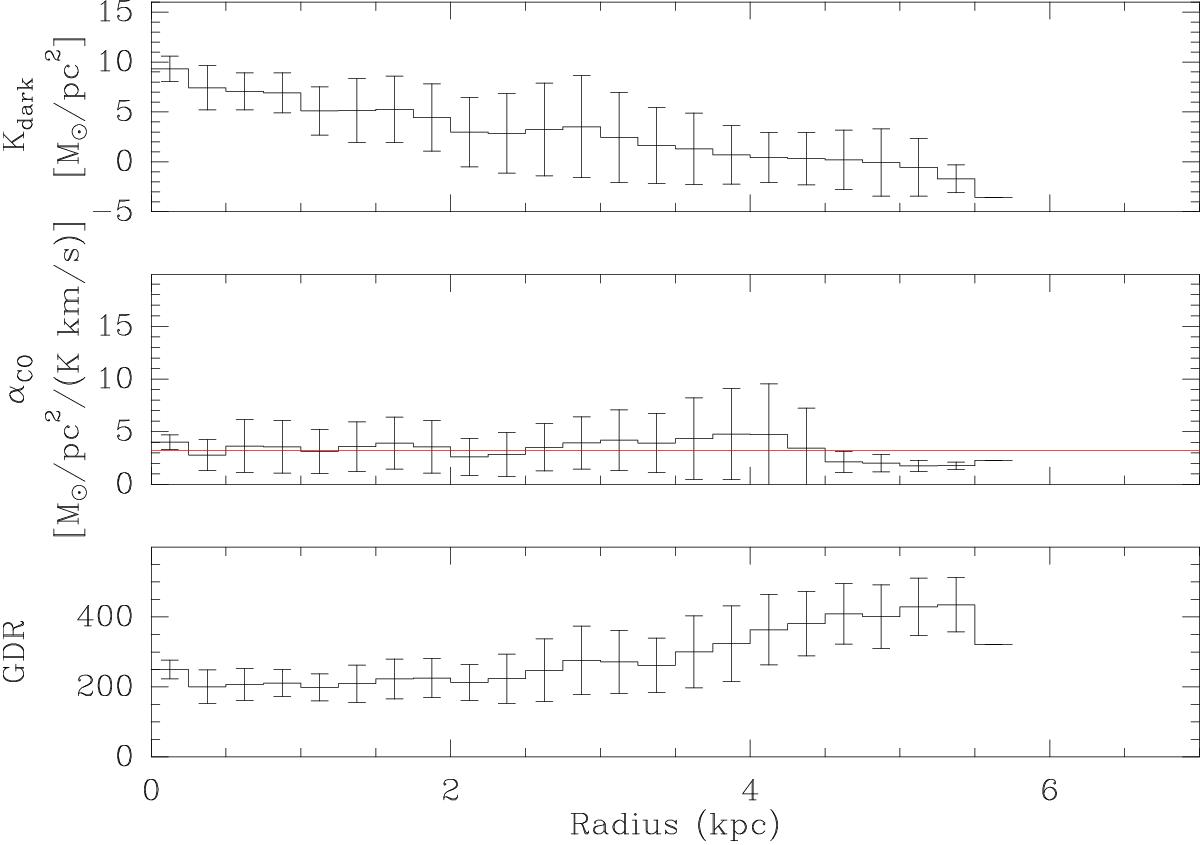
Radial variation of Kdark, αCO, and GDR for the simulation with a cut at 3σ for the CO and GDR capped at 500. The value is computed using the maps in Fig. 16 and weighting each macropixel according to is area within a given radial annulus. The error bars indicate the dispersion within this ring.
Current usage metrics show cumulative count of Article Views (full-text article views including HTML views, PDF and ePub downloads, according to the available data) and Abstracts Views on Vision4Press platform.
Data correspond to usage on the plateform after 2015. The current usage metrics is available 48-96 hours after online publication and is updated daily on week days.
Initial download of the metrics may take a while.