Fig. 12
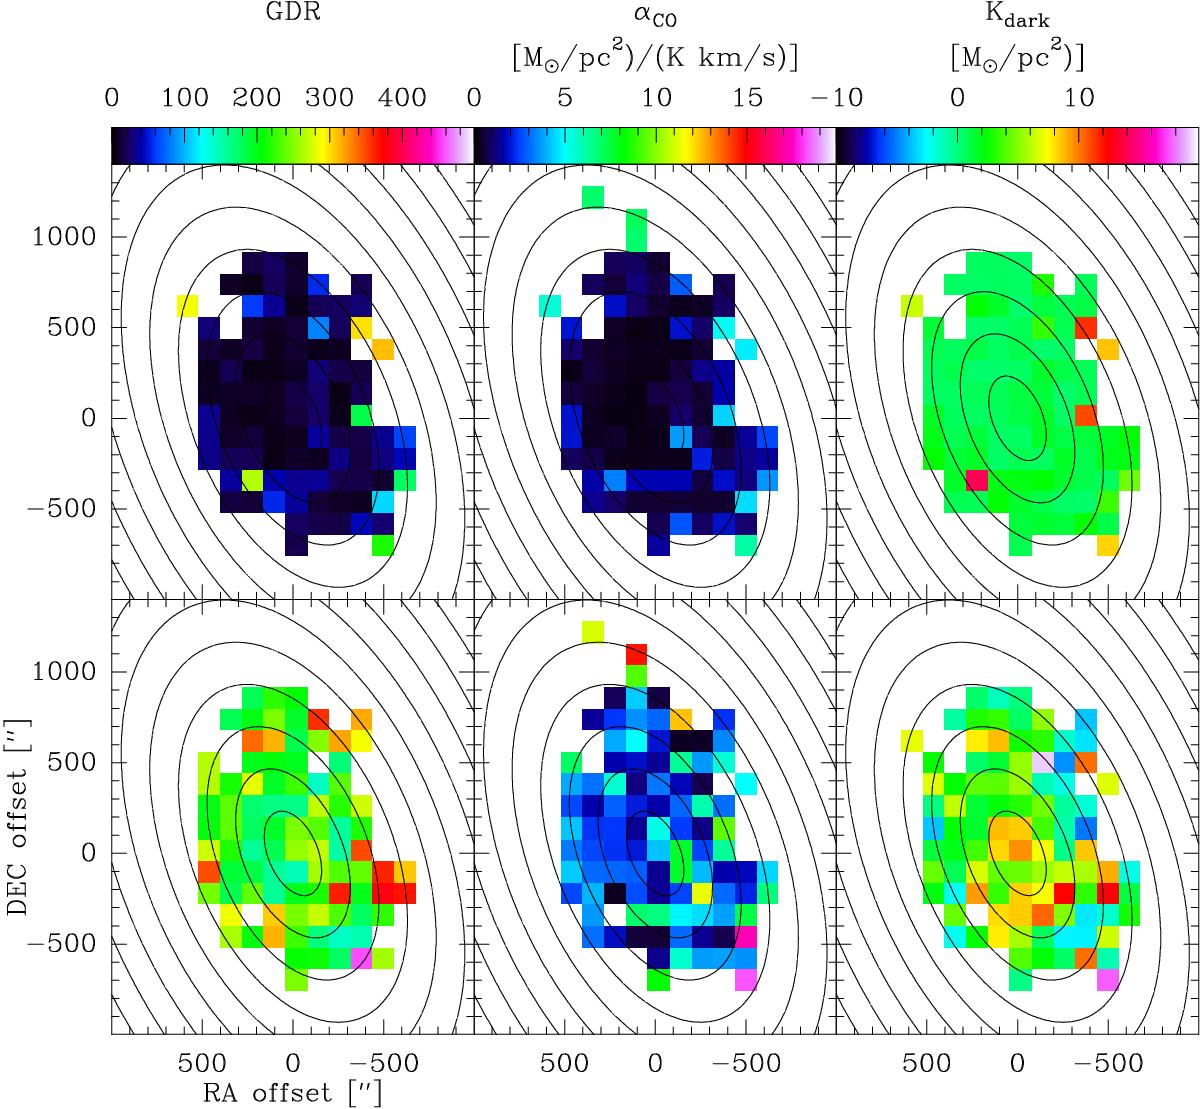
Results of Bayesian analysis with a 3σ cut in CO and no cap on GDR. Top row is Kdark (left) and uncertainty in Kdark (right), both with the color scale to the right and in units of M⊙/ pc2. The second row is XCO (left) and uncertainty in XCO (right), both with the color scale to the right and in units of M⊙/ pc2 per K km s-1. Bottom row is GDR (left) and uncertainty in GDR (right), both with the color scale to the right. As with the other figures, we have adopted the variable-beta dust surface density shown in Fig. 2.
Current usage metrics show cumulative count of Article Views (full-text article views including HTML views, PDF and ePub downloads, according to the available data) and Abstracts Views on Vision4Press platform.
Data correspond to usage on the plateform after 2015. The current usage metrics is available 48-96 hours after online publication and is updated daily on week days.
Initial download of the metrics may take a while.