Fig. A.1
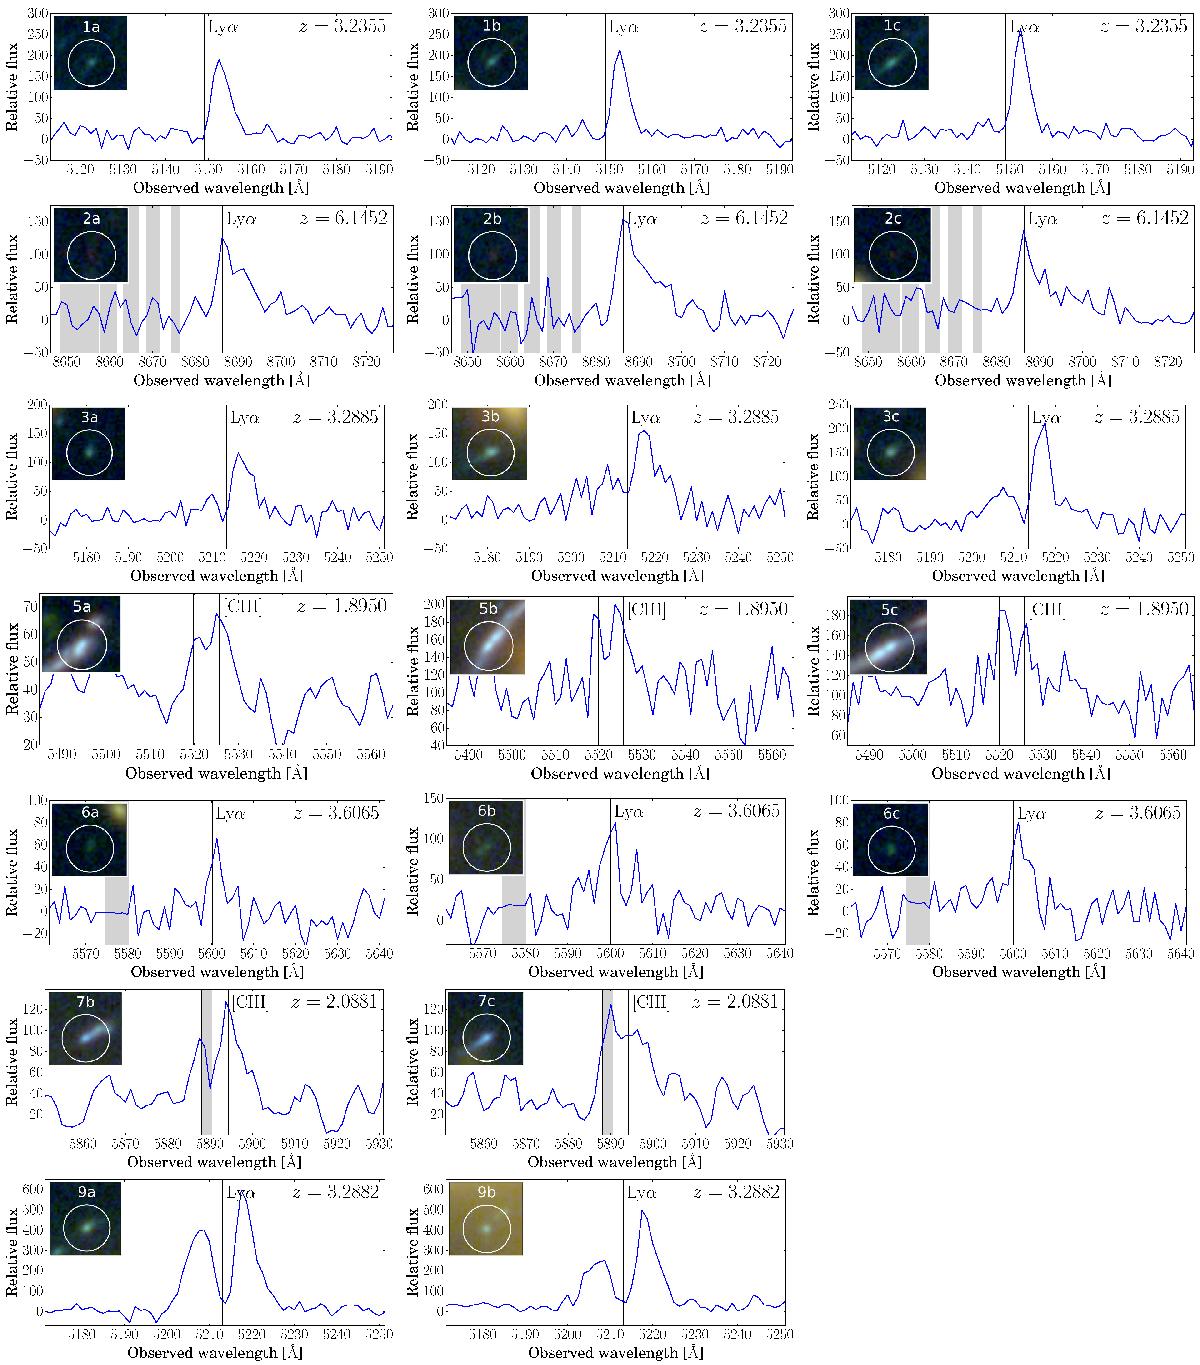
MUSE spectra of multiple images of lensed sources in MACS 0416. Panels on the same line show the spectra of multiple images belonging to the same family, i.e., associated to the same source. The vertical black lines indicate the position of the emission line based on the best estimate of the systemic redshift (see Table A.1 notes). Spectral regions with high sky contamination are marked in grey; the flux is given in units of 10-20 erg s-1 cm-2 Å-1. The image cutouts in each panel (2″ across) are extracted from the HFF color image and show the HST counterparts, or are centered at the position of the MUSE emission in the cases of no apparent counterparts (see families 21 and 35).
Current usage metrics show cumulative count of Article Views (full-text article views including HTML views, PDF and ePub downloads, according to the available data) and Abstracts Views on Vision4Press platform.
Data correspond to usage on the plateform after 2015. The current usage metrics is available 48-96 hours after online publication and is updated daily on week days.
Initial download of the metrics may take a while.